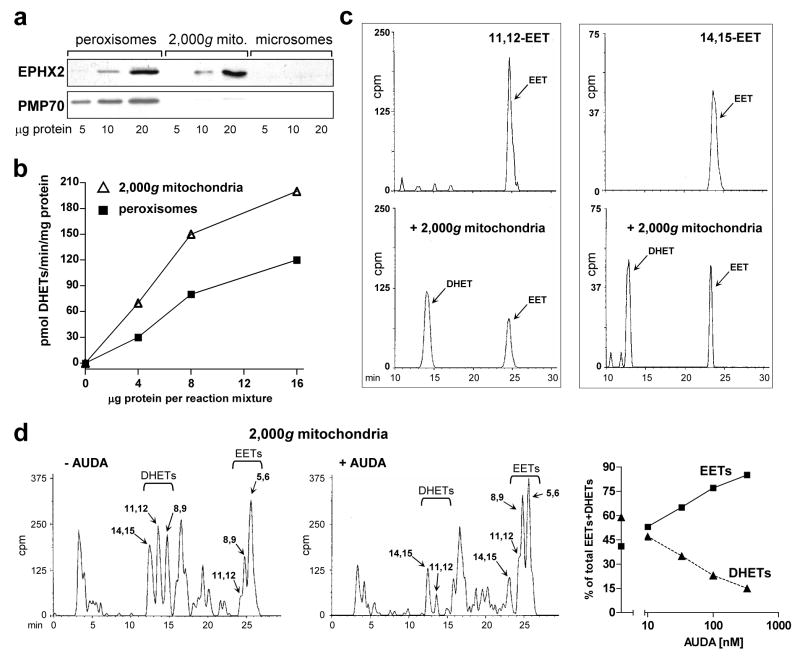
Figure 5. Mitochondrial soluble epoxide hydrolase.
a. Presence of soluble epoxide hydrolase (sEH) in CE liver mitochondria and peroxisomes. Western blots of peroxisomes, 2,000g mitochondria and microsomes prepared as described in “Materials and Methods”, with antibodies to soluble epoxide hydrolase (EPHX2/sEH, 63 kDa) and PMP70 (peroxisomal marker, 70 kDa). The blot shows representative samples from control livers. b. DHET formation by peroxisomes and 2,000g mitochondria. Four, 8 and 16 μg of protein from peroxisomes (squares) and mitochondria (triangles) from control CE livers were added to standard reaction mixtures for assaying microsomal aa metabolism, using microsomes from TCDD-treated CE liver (75 μg microsomal protein per reaction mixture) to generate EETs, as described in “Materials and Methods”. The production of EETs and DHETs after 10 min of incubation was measured. DHET formation, reflecting the sum of 8,9–11,12- and 14,15-DHETs (5,6-DHET was absent), is plotted in the graph. DHETs formed by microsomes alone (without addition of peroxisomes or 2,000g mitochondria; see Fig. 4g for example) were subtracted. c. Conversion by mitochondria of [1-14C] 11,12 and 14,15 EETs to the corresponding DHETs. [1-14C] 11,12 or 14,15 EET were incubated alone (top panels) or with 2,000g mitochondria from control (untreated) CE liver (bottom panels), at 50 μg of mitochondrial protein, for 20 min in a shaking water bath at 37°. The reaction was stopped and products were extracted and resolved on HPLC as described for aa metabolism in “Materials and Methods”. The EETs and corresponding DHETs exhibited the expected retention times (see legend to Fig. 2d). Total cpm in the chromatogram pairs were comparable: 1288 and 1505 for 11,12 EET alone or with mitochondria respectively, and 414 and 467 for 14,15 EET alone or with mitochondria. d. AUDA inhibits DHET formation by mitochondria. Reverse phase HPLC chromatograms for aa metabolism by 2,000g mitochondria (150 μg per reaction mixture) from livers of CE treated with TCDD for 24 hr in the absence (left panel) or presence (right panel) of 330 nM of AUDA are shown. Total cpm were 154,179 and 145,361 for the left and right panels respectively. Arachidonic acid metabolism was assayed as described in “Materials and Methods” except that mitochondria were first preincubated with AUDA for 10 min at 30° before adding the other components of the reaction mixture. The right panel shows the dose response relationships for suppression of DHET formation by AUDA at 10 to 330 nM (squares, EETs; triangles, DHETs). The distribution of EETs and DHETs in the absence of AUDA (43.3 ± 1.2 % and 56.7 ± 1.2 %, respectively) are plotted on the y axis; the SE is included in the symbol. Control values for mitochondrial EET and DHET formation in the absence of AUDA (pmol/mg/min ± SE) were 103 ± 5.6 for EETs, and 133 ± 3.8 for DHETs, n = 3.

