
Figure 4.
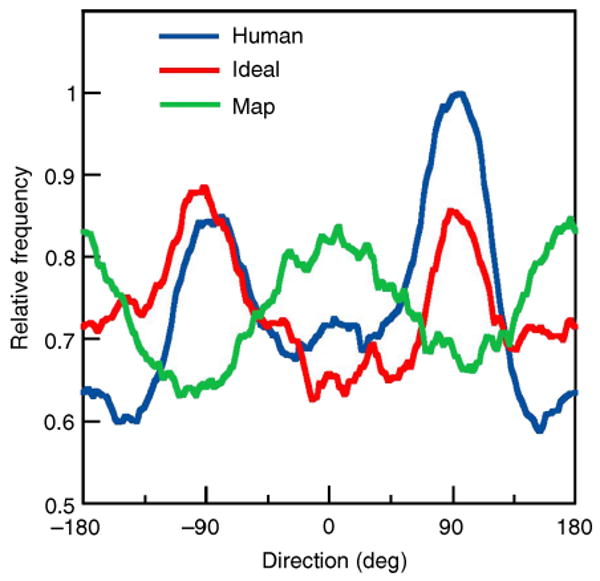
Direction histograms of fixation location relative to the center of the display. The histograms were obtained with a sliding summation window having a width of 45 deg. All three histograms were normalized by the maximum frequency for the human searchers.