
Figure 5.
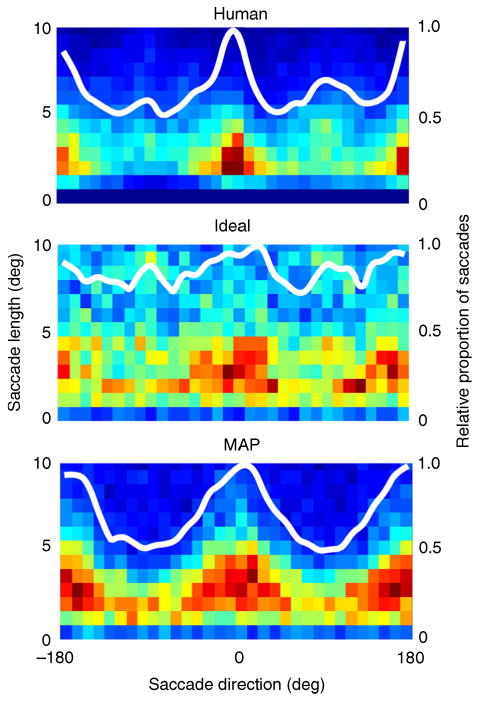
Distribution of saccade vectors for human, ideal, and MAP searchers. In each plot, the saccade take-off point is taken to be the origin, and the color temperature reflects the density of the landing points relative to the origin. In these plots, a rightward saccade has a direction of 0 deg and an upward saccade a direction of 90 deg. The color temperature scale is the same as in Figure 3. The white contours show the relative proportion of saccades in each direction (axis on the right).