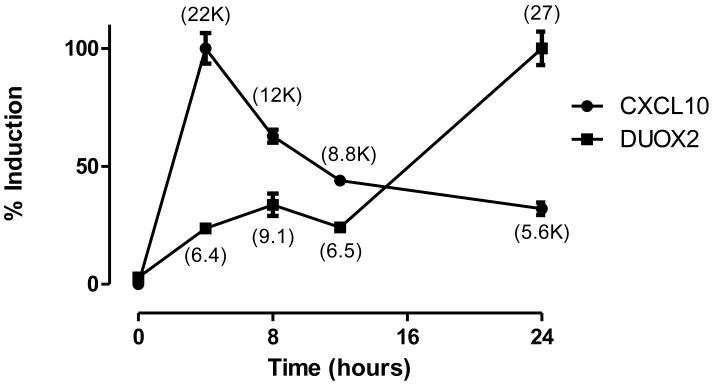
Figure 4. Time course comparison of DUOX2 and CXCL10 induction.
HBE1 cells were treated with IFNγ (100 ng/mL) for 2 hours and harvested for total RNA at various time points using the start of IFNγ exposure as t=0. rt-QPCR analyses of mRNA expression are presented as a percentage of fold-induction compared to maximum induction. Numbers in parentheses represent observed fold-induction for DUOX1 or CXCL10 normalized to β-actin by defining the average 2−ΔΔCt value of untreated samples at all time points as 1. K=1000-fold. Data are representative of four separate experiments and mean ± SD are shown.

