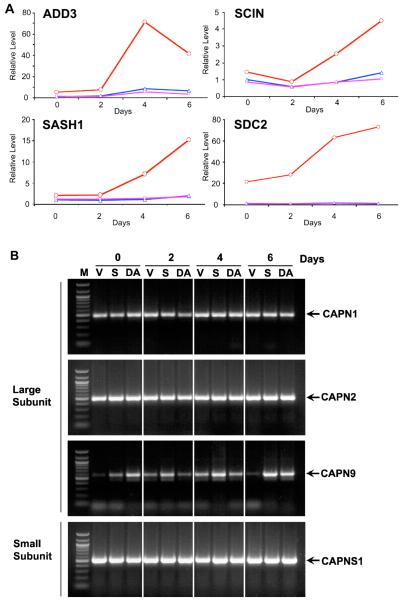
Figure 1. Quantitative PCR analysis of expression levels of SDC2, SASH1, ADD3, and SCIN in CEACAM1-4S transfected cells grown in matrigel and expression of calpain genes by PCR.
A: MCF7 cells transfected with vector only (blue), wild type (red), or double mutant T457A,S459A CEACAM1-4S (magenta) were grown in Matrigel for 0, 2, 4, or 6d, cells harvested, RNA isolated, and Q-PCR analysis performed using primers for ADD3, SASH1, SCIN, SDC2 and GAPDH. Results were normalized to GAPDH. B: MCF7 cells transfected with vector only (V), wild type (S), or double mutant T457A,S459A CEACAM1-4S (DA) were grown in Matrigel for 0, 2, 4, or 6d, cells harvested, RNA isolated, and RT-PCR analysis performed using primers for CAPN1, CAPN2, CAPN9, and CAPNS1 (M= DNA markers).

