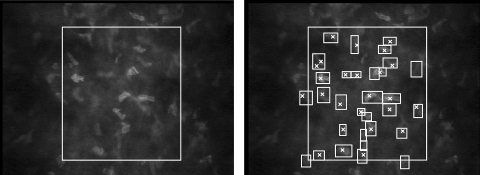
Figure 1.
Image of normal midstroma recorded with ConfoScan 4. Left: the brightness of the field decreased considerably outside the rectangular area used to assess cell density. Right: ×, each object identified manually by an observer as a cell nucleus; rectangles: each object identified by the program as a cell. Cells that overlapped the left or bottom boundary were counted, whereas the cells that touched the right or top boundary were not. In this frame, the program selected more objects as cells than the observer did, although in some frames the program selected fewer.

