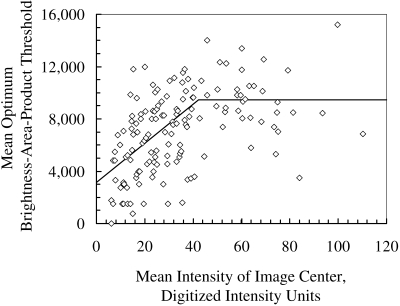
Figure 2.
The BAPthr for identifying cells from objects in each frame changed as image intensity increased. Each marker represents the optimum BAPthr, which forced the cell density determined automatically to be equal to that determined manually. The fitted line, determined by the least-squares method when intensity was below 40 and by a simple mean when intensity was above 40, was used to determine the BAPthr within each frame.

