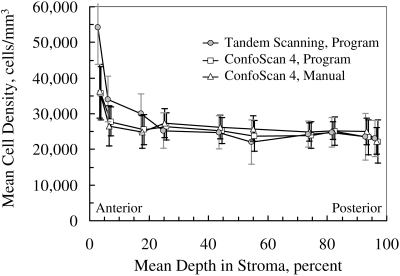
Figure 5.
Mean cell densities in 16 normal corneas determined by automatic and manual methods in images from the ConfoScan 4 and by automated method from scans by the Tandem Scanning confocal microscope. Densities agreed between instruments in all layers except the anterior 10% of stromal depth. The markers have been offset slightly for clarity. Error bars, ± SD.

