Figure 2.
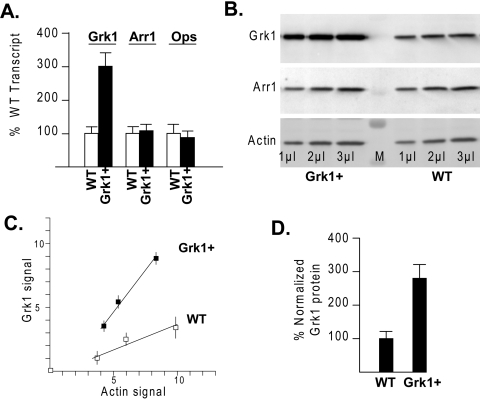
Grk1 expression levels in Grk1+ transgenic eyes. (A) Real-time RT-PCR was used to estimate relative Grk1, Arr1 (visual arrestin 1), or rhodopsin (Ops) transcript levels in Grk1+ eyes as a percent of the WT levels. The percentages were based on the net number of cycles to threshold based on the formula R = 100(2−ΔΔCt). Results from at least 6 to 10 amplifications from various Grk1 and WT RNA pools were used to arrive at the average and SEM. (B) Immunoblot analysis from Grk1+ and WT eye proteins were sequentially stained with specific antibodies for Grk1, Arr1 (rod arrestin), and actin at varying loads. Band volume (pixel depth × area) quantification and background subtraction were performed after digital acquisition of chemiluminescent images. (C) Grk1 band volumes were plotted against the actin band volume for increasing volumes of Grk1+ and WT samples. The units on each axis are arbitrary and depend on the density. The experiments represent an average of at least three blots from three independent pools of Grk1+ and WT eyes. (D) Relative levels of Grk1 in Grk1+ as a percentage of WT littermates were based on the ratio of the slopes in (C).

