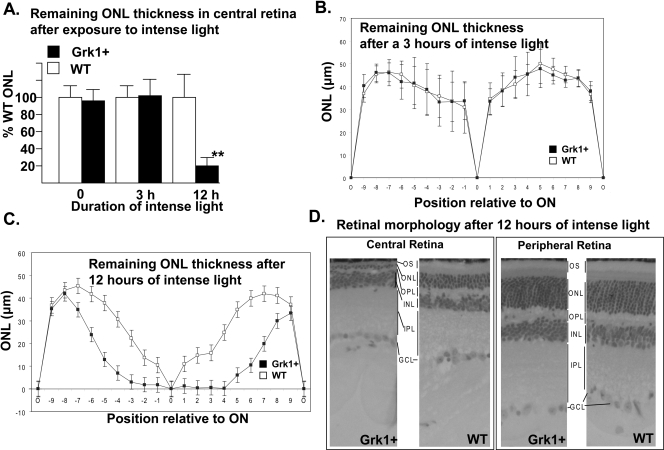
Figure 6.
Evidence of differential photoreceptor cell loss in Grk1+ and WT retinas. (A) Average ONL thickness for Grk1+ central retina positions −3 to 3 is shown as a percent of thickness of WT ONL in the corresponding region after equivalent treatments for 0, 3, and 12 hours in intense light (10,000 lux). Rpe65 Leu450Met heterozygous, sex-matched mice underwent dark adaptation before exposure to intense light and remained 10-days in the dark after exposure before euthanatization and retrieval of the globes (n = 6–12 per time point). **Statistical significance, P < 0.0004. (B, C) Comparison of ONL thickness across the entire superior (+0–9) and inferior (−9–0) retina between untreated and treated mice. (D) Representative central and far peripheral retinas of Grk1+ and WT mice after 12-hour exposure to intense light. Because of the severe light-induced damage in the central retina of the Grk1+ animals, the outer and inner photoreceptor segments were obliterated, with the ONL reduced to a single row of nuclei against a markedly thinned OPL. OS, outer segment; ON, optic nerve; ONL, outer nuclear layer; OPL, outer plexiform layer; INL, inner nuclear layer; IPL, inner plexiform layer; GCL, ganglion cell layer.

