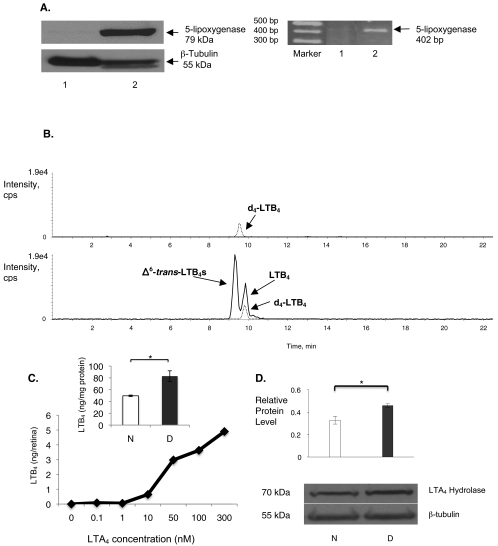
Figure 3.
Leukotriene synthesis by mouse retina. (A) Western blot analysis (left) and RT-PCR (right) analysis of mouse retina (lane 1) did not detect 5-lipoxygenase expression. As anticipated, 5-lipoxygenase was detected in mouse bone marrow cells (lane 2). Data are representative of the results in retinas isolated from six different mice. (B) Mass spectrometric analysis of methanol extracts of mouse retina did not detect leukotriene metabolites. Upper tracing: internal standard deuterated LTB4 ([d4]-LTB4). After the addition of LTA4 to the mouse retina, LTB4 was produced (lower tracing). Nonenzymatic generation of Δ6-trans-LTB4 was also detected. (C) Increasing the dose of exogenous LTA4 (0–300 nM) resulted in an increase in endogenous LTB4 production. The dose-response curve was generated using six retinas, with each retina receiving a different dose of LTA4. (C, inset) After the addition of 100 nM LTA4, LTB4 synthesis was increased in retinas from diabetic mice (D, black bar) compared with retinas from nondiabetic mice (N, white bar; n = 3 retinas per group; *P < 0.02). (D) By Western blot analysis, the expression of LTA4 hydrolase in retinas of diabetic mice (D, n = 6) was increased compared with that of nondiabetic mice (N, n = 6; *P < 0.001). The level of protein expression is depicted relative to the reference protein β-tubulin.

