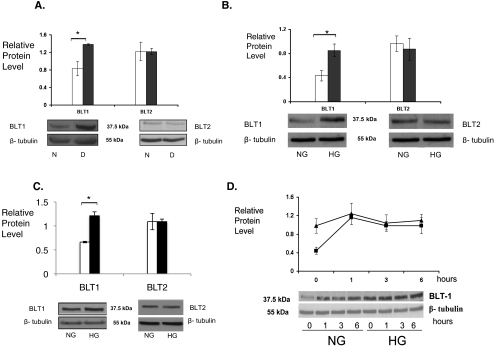
Figure 6.
High glucose increases BLT1 receptor expression. Western blot analysis of mouse retinas (A), mouse retinal glial cells (B), and mRECs (C) demonstrated a high glucose-induced increase in BLT1 expression, but not BLT2 expression (physiologic glucose: N or NG, white bars; high glucose: D or HG, black bars). For analysis of mouse retinas, six diabetic and six nondiabetic retinas were analyzed (BLT1; *P < 0.01). Experiments with cultured cells were conducted in triplicate. (BLT1; *P < 0.005 for mouse retinal glial cells and for mRECs). (D) Addition of LTB4 to retinal glial cells grown in physiologic glucose (NG) concentrations induced the expression of BLT1 (squares). Maximal expression of BLT1 under these conditions was similar to the increased expression of BLT1 seen under high-glucose (HG) conditions (triangles). The level of protein expression is depicted relative to the reference protein β-tubulin.

