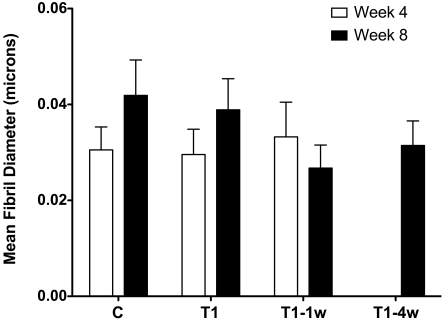
Figure 3.
Fibril diameter as measured in approximately 10 high-magnification (31,000x) TEM images. Ten fibrils were measured per photo per group and time point. At least 100 fibrils were measured per group. At 4 weeks, the fibril diameter of C, T1, and T1–1w all appeared to be comparable to that in vivo (30–33 μm). Compared with C, T1 is not statistically significant at 4 weeks, whereas, T1–1w versus C is significant (P < 0.05). At 8 weeks, the differences observed in C versus T1, T1–1w, and T1–4w are statistically significant (P < 0.05). Week 8 is statistically significant compared with week 4 in each condition (P < 0.05).

