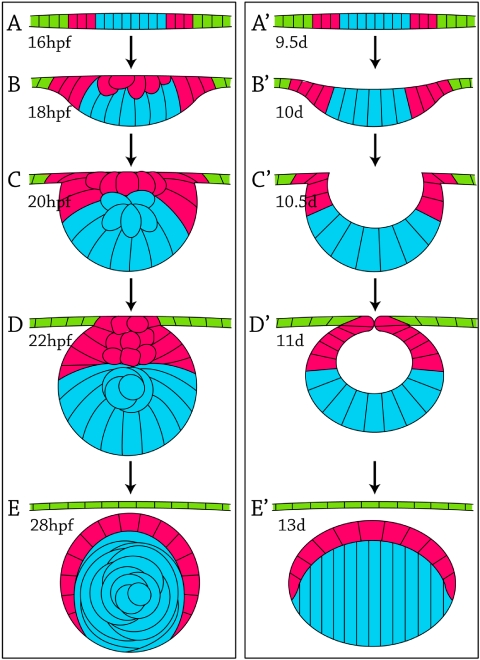
Figure 7.
Comparison of lens development in the zebrafish (A–E) and mouse (A′–E′) with color-coded cell-fate maps: primary fibers (blue), anterior lens epithelium (pink), and cornea (green). All cells in this diagram would be nucleated (not shown). Approximate ages are listed in hpf for the zebrafish and days (d) for the mouse.

