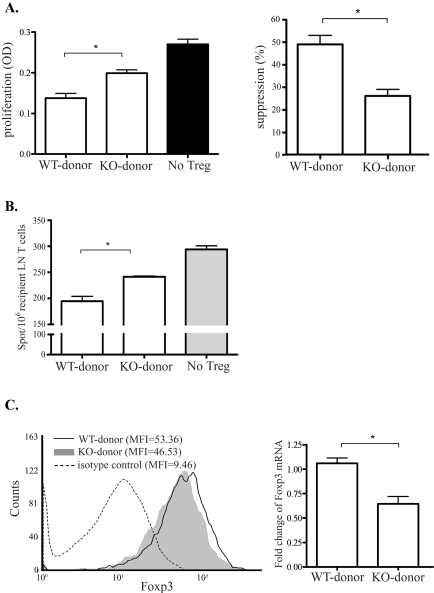
Figure 4.
Comparison of recipients' Treg function based on donor tissue CCR7 expression. Tregs (CD4+CD25+) were sorted from the draining LNs of recipients at 2 weeks after transplantation to evaluate their functionality. (A) Treg suppression assay showing the level of CD3-mediated proliferation of naive BALB/c CD4+ T cells with the Tregs from different recipient groups using BrdU assay (left). Accordingly, the suppression effect of these Treg was calculated as % suppression = [(T-cell proliferation without Treg − T-cell proliferation with Treg)/T-cell proliferation without Treg] × 100 (right). Results are depicted as the percentage of suppression (mean ± SEM) and represent the results of 1 of 3 independent experiments (*P < 0.01). (B) IFN-γ ELISPOT assay showing frequencies of directly primed T cells in different graft recipients. Responder T cells from the recipients at high risk with WT allografts were cocultured with the Tregs isolated from the recipients of CCR7−/− or WT allografts and were stimulated with C57BL/6 APCs. The results are depicted as the number (mean ± SEM) of spots per million responder T cells loaded and represent the results 1 of 3 independent experiments (*P < 0.05). (C) CD4+CD25+ Tregs isolated from the draining LNs of different graft recipient groups. Left: flow cytometric histogram showing expression levels (mean fluorescence intensity) of Foxp3 in these Tregs. Right: values are expressed as the fold change of Foxp3 mRNA expression levels of these Tregs in the CCR7−/− donor group over the WT donor group, normalized to GAPDH expression. Results represent the mean (± SEM) of four samples per group (each sample consisted of 1 LN), and the data are representative of two independent experiments (*P < 0.01).

