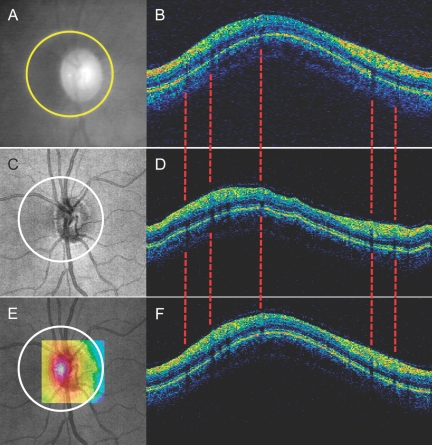
Figure 5.
Scan location matching sample: (A, B) Fundus video (A) and cross-sectional OCT (B) images of a TD-OCT circular scan; (C, D) OCT fundus (C) and virtually resampled cross-sectional OCT (D) images of a SD-OCT 3-D scan on the same eye; (E) Similarity map generated by computing correlation coefficients between TD-OCT data and virtually resampled data centered at each pixel within the resampling center boundary (color range correlation coefficient 0, dark blue, to 1, white); (F) Aligned matching virtually resampled image. Note that the locations of the vessel shadows nicely match up with TD-OCT image (dashed lines).

