Systematic study of scanning density for spectral domain OCT volume acquisitions suggests that reduced scanning densities may be sufficient for calculation of retinal thickness maps. These findings may be useful for designing scanning protocols for clinical trials and clinical practice.
Abstract
Purpose.
To investigate the relationship between B-scan density and retinal thickness measurements obtained by spectral domain optical coherence tomography (SDOCT) in eyes with retinal disease.
Methods.
Data were collected from 115 patients who underwent volume OCT imaging with Cirrus HD-OCT using the 512 × 128 horizontal raster protocol. Raw OCT data, including the location of the automated retinal boundaries, were exported from the Cirrus HD-OCT instrument and imported into the Doheny Image Reading Center (DIRC) OCT viewing and grading software, termed “3D-OCTOR.” For each case, retinal thickness maps similar to those produced by Cirrus HD-OCT were generated using all 128 B-scans, as well as using less dense subsets of scans, ranging from every other scan to every 16th scan. Retinal thickness measurements derived using only a subset of scans were compared to measurements using all 128 B-scans, and differences for the foveal central subfield (FCS) and total macular volume were computed.
Results.
The mean error in FCS retinal thickness measurement increased as the density of B-scans decreased, but the error was small (<2 μm), except at the sparsest densities evaluated. The maximum error at a density of every fourth scan (32 scans spaced 188 μm apart) was <1%.
Conclusions.
B-scan density in volume SDOCT acquisitions can be reduced to 32 horizontal B-scans (spaced 188 μm apart) with minimal change in calculated retinal thickness measurements. This information may be of value in design of scanning protocols for SDOCT for use in future clinical trials.
Optical coherence tomography (OCT) has evolved into an essential tool for the management of patients with vitreoretinal disorders.1 The ability to produce retinal thickness maps is a key element of OCT imaging—average thickness measurements derived from these maps (eg, foveal central subfield [FCS]) have become important outcome parameters in clinical trials, and are used by many clinicians to monitor patients' response to therapy.2,3 The accuracy of such measurements is dependent on automated detection (segmentation) of the inner and outer retinal boundaries by the OCT instrument software.4 However, errors in automated segmentation commonly occur, and are often severe, particularly in diseases that result in significant disruption of the outer retina (eg, neovascular age-related macular degeneration [AMD]).5–8 These errors may explain, at least in part, why many studies have failed to find a significant correlation between OCT-derived retinal thickness and visual acuity.9,10 As a result, manual correction of these errors is often performed in dedicated reading centers to ensure that accurate data are provided for analysis in clinical trials.11
Aside from segmentation errors, however, another potential concern in the accuracy of retinal thickness maps, is artifact introduced by interpolation of data between OCT scan lines.12 Time domain OCT instruments, such as Stratus OCT (Carl Zeiss Meditec, Dublin, CA) have slow image acquisition speeds and, as a result, specialized scanning protocols are required to allow topographic assessment of the entire macula.13 In these devices, the most commonly used macular thickness protocols consist of six radial line B-scans, offset by 30°, and passing through the foveal center. Use of such protocols allows concentration of retinal sampling near the foveal center, but means that there is significant separation between sampled points at the periphery of the B-scan; extensive interpolation is thus required for construction of retinal thickness maps.4,14 In contrast, recently introduced spectral domain OCT (SDOCT) instruments, such as Cirrus HD-OCT (Carl Zeiss Meditec), offer dramatically improved image acquisition speeds, allowing more complete coverage of the macula with raster scans, and potentially reducing the need for interpolation when generating retinal thickness maps.15,16
In SDOCT devices, the need for interpolation is dependent on the number of B-scans in the raster scan protocol; however, the B-scan density required to produce reliable retinal thickness maps is unknown. Despite the rapid speed of SDOCT devices, eye movements remain a problem when very high sampling density is required.1 In addition, measurements from SDOCT remain prone to segmentation error, particularly in the context of structurally complex disease6,8; and, unlike time domain OCT, manual correction of segmentation errors in typical SDOCT scanning protocols is unlikely to be practical.17 If a fewer number of B-scans were shown to yield similar results, less dense scanning protocols could be used for map generation, thereby reducing the impact of eye motion and increasing the feasibility of manual error correction. As SDOCT devices are increasingly incorporated into both clinical trials and practice, these issues are likely to be of critical importance in providing accurate anatomic measurements.
In this report, we study the impact of OCT B-scan density on retinal thickness measurements obtained from a single SDOCT device, Cirrus HD-OCT.
Materials and Methods
Data Collection
OCT images were collected and reviewed from a series of consecutive patients referred for Cirrus HD-OCT imaging, between January and October 2008, from a tertiary retina and ophthalmology subspecialty practice at the Doheny Eye Institute. Approval for data collection and analysis was obtained from the institutional review board of the University of Southern California. The research adhered to the tenets set forth in the Declaration of Helsinki.
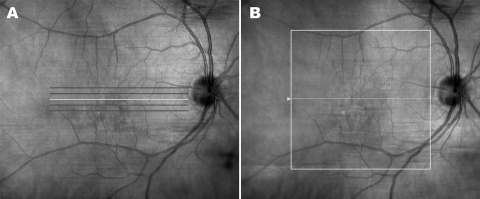
For Cirrus HD-OCT, the standard macular imaging protocol in the Doheny Ophthalmic Imaging Unit consists of the Macular Cube and the 5 Line Raster scanning protocols (Fig. 1). The high definition 5 Line Raster protocol is typically used for qualitative assessments, while retinal thickness maps are provided by the Macular Cube protocol. The Macular Cube protocol consists of 128 horizontally oriented B-scans, each 6 mm in length and composed of 512 equally spaced transverse sampled locations. All 128 OCT B-scans are acquired in a continuous, automated sequence and cover a 6 mm × 6 mm area.
Figure 1.
For Cirrus HD-OCT, the standard macular imaging protocol in the Doheny Ophthalmic Imaging Unit consists of the 5 Line Raster (A) and the Macular Cube (B) scanning protocols. The Macular Cube protocol consists of 128 horizontally oriented B-scans, each 6 mm in length and composed of 512 equally spaced transverse sampled locations.
To determine eligibility for inclusion in this study, a certified Doheny Image Reading Center OCT grader (PAK) reviewed all 128 B-scans for each case to select 115 consecutive cases with adequate segmentation according to previously reported criteria.8 The OCT data for these 115 cases were exported to disc using the export feature available in the Cirrus HD-OCT version 3.0.0.64 software. For each case, the clinical chart was also reviewed to identify the referring diagnosis or disease.
Generation of Retinal Thickness Maps
A software tool, entitled “OCTOR,” has previously been created by Doheny Image Reading Center software engineers to facilitate viewing and manual grading of time domain OCT datasets. OCTOR is publicly accessible at http://www.diesel.la and has been described and validated in previous reports.18–20 OCTOR has recently been updated to allow analysis of SDOCT datasets (eg, Cirrus HD-OCT Macular Cube protocol), and has been renamed “3D-OCTOR” to reflect this. In a similar fashion to the original OCTOR software, 3D-OCTOR allows importation of raw OCT image data and retinal boundaries (from automated segmentation), and the generation of retinal thickness maps analogous to those produced by the OCT manufacturers' software. Much like the first generation OCTOR, 3D-OCTOR uses the dimension of the B-scan image (as specified by the manufacturer) to convert the number of pixels between the inner and outer retinal boundaries into a thickness measurement at each A-scan location. The thicknesses at all unsampled locations, between the raster scans, are then interpolated based on a linear approximation (using nearest neighbor sampling between A-scans, followed by bilinear sampling between B-scans) to yield a retinal thickness map. The precise interpolation algorithms used by Cirrus HD-OCT and other SDOCT instruments are proprietary and not publically available.15 Therefore, to validate that the measurements provided by 3D-OCTOR were similar to those provided by Cirrus HD-OCT, thickness measurements from all nine Early Treatment of Diabetic Retinopathy Study (ETDRS) subfields were compared in all cases.
Modulating B-scan Density
To determine the relationship between retinal thickness measurements and B-scan sampling density, 3D-OCTOR was used to re-generate retinal thickness maps after elimination of varying numbers of intervening B-scans. A total of five different B-scan densities (with even spacing of the B-scans) were evaluated: all B-scans (128 B-scans, spaced 47 μm apart), every other B-scan (total of 64 B-scans, 94 μm apart), every fourth B-scan, and so on, up to every 16th B-scan (total of 8 B-scans, 750 μm apart). Measurements for each of the EDTRS subfields and the total macular volume were computed for each sampling density (1/1, 1/2, 1/4, 1/8, 1/16).
Statistical Methods
The retinal thickness measurements computed using all available B-scans in the Macular Cube protocol (ie, 1:1) were considered the “ground-truth” to which measurements from all other sampling densities were compared. For each case, the difference (“error”) from the ground-truth value for the FCS, and the total macular volume, was calculated for each sampling density. Mean differences were calculated using absolute values (as opposed to a simple mean, which could potentially mask or minimize apparent differences). Relative (percentage) differences were calculated by dividing the value of the difference between the two measurements by the mean of the two measurements, and multiplying by 100). Bland-Altman plots were generated to facilitate comparisons between values for each B-scan sampling density and ground-truth measurements. The effect of disease diagnosis on mean error was also studied. All statistical analysis was performed using commercially available software (Intercooled Stata for Windows, Version 9; Statacorp LP, College Station, TX). The accepted level of significance for all tests was P ≤ 0.05.
Results
Demographic Characteristics
A total of 115 consecutive cases of patients imaged with the Cirrus HD-OCT at the Doheny Eye Institute Ophthalmic Imaging Unity, using the Macular Cube (512 × 128) volume scan protocol, met the criteria for inclusion in the series. The mean age of the patients was 63 years, and 47% were women. The primary referring diagnosis in the selected cases was retinal vascular disease (eg, diabetic retinopathy, retinal vein occlusion) in 34 cases (29.6%), choroidal vascular disease (eg, neovascular AMD) in 11 cases (9.6%), and abnormalities of the vitreomacular interface (eg, vitreomacular traction, epiretinal membrane) in 24 cases (20.9%). A more detailed breakdown of all disease groups, with exact disease diagnoses, is provided in Table 1.
Table 1.
Baseline Characteristics–Disease Diagnosis
| Primary Disease Diagnosis | n |
|---|---|
| Retinal vascular disease | |
| Diabetic retinopathy | 27 |
| Retinal vein occlusion | 7 |
| Age-related macular degeneration | |
| Non-neovascular | 12 |
| Neovascular | 10 |
| Vitreomacular interface abnormalities | |
| Epiretinal membrane | 22 |
| Vitreomacular traction | 2 |
| Other | |
| Uveitis | 11 |
| Post retinal detachment repair | 8 |
| Retinitis pigmentosa | 7 |
| Pseudophakic CME | 4 |
| Chronic CSCR | 2 |
| Pathologic myopia | 2 |
| Idiopathic CNV | 1 |
CME, cystoid macular edema; CSCR, central serous chorioretinopathy; CNV, choroidal neovascularization.
Comparison of 3D-OCTOR Interpolation and Cirrus HD-OCT Interpolation Algorithms
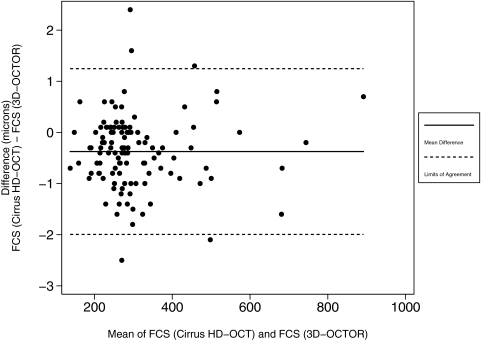
Table 2 illustrates the level of agreement between the interpolation methods used by 3D-OCTOR and Cirrus HD-OCT, when the two methods were applied to the same Cirrus-obtained retinal boundaries. A Bland-Altman plot of the mean difference between the two analysis methods for the FCS thickness is shown in Figure 2.
Table 2.
Comparison of 3D-OCTOR and Cirrus HD-OCT Interpolation Algorithms
| OCT Output Parameter | Mean Cirrus HD-OCT Retinal Thickness |
Absolute Difference, Mean [Median, Maximum] (μm)* | Percent Difference, Mean [Median, Maximum] (%)† | |
|---|---|---|---|---|
| Cirrus HD-OCT Interpolation (μm) | 3D-OCTOR Interpolation (μm) | |||
| Foveal central subfield (subfield 9) | 306.77 | 307.14 | 0.61 [0.50, 2.50] | 0.05 [0.04, 0.23] |
| Inner circle (subfields 5–8) | 336.54 | 337.34 | 0.82 [0.55, 12.25] | 0.23 [0.16, 2.50] |
| Inner circle (subfields 1–4) | 290.15 | 291.17 | 1.02 [0.75, 9.25] | 0.34 [0.26, 2.92] |
Calculated by subtracting thickness measurements obtained using the 3D-OCTOR interpolation method (on the Cirrus-obtained retinal boundaries) from measurements obtained using the Cirrus HD-OCT interpolation method for each case, and then taking the absolute value.
Percent Difference = (Absolute Difference/(Cirrus HD-OCT interpolation measurement + 3D-OCTOR interpolation measurement)/2) · 100).
Figure 2.
Bland-Altman plot demonstrating level of agreement between the Cirrus HD-OCT and 3D-OCTOR interpolation methods for the foveal central subfield (FCS). Solid horizontal line: the simple mean difference (−0.374 μm); dashed horizontal lines: the 95% limits of agreement (−1.995 μm to +1.247 μm).
B-scan Sampling Density and Foveal Central Subfield Thickness
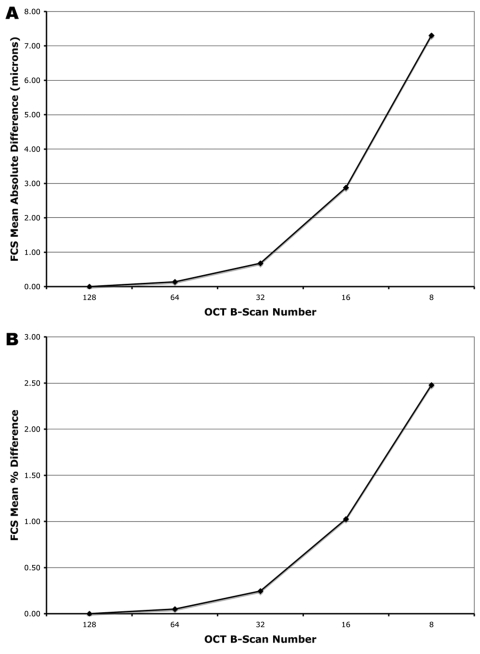
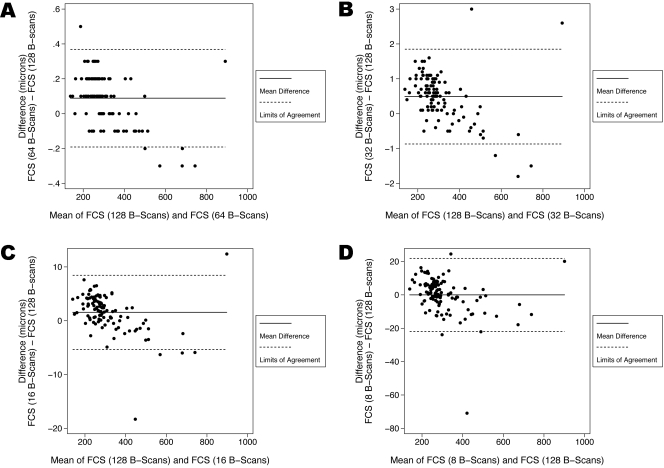
For the FCS thickness, the mean absolute error was 0.14 ± 0.09 μm with 64 B-scans (1/2), 0.68 ± 0.49 μm with 32 B-scans (1/4), 2.88 ± 2.44 μm with 16 B-scans (1/8), and 7.31 ± 8.12 μm with 8 B-scans (1/16) (Fig. 3A). The maximum absolute error was 0.50 μm for 64 B-scans, 3.00 μm for 32 B-scans, 18.30 μm for 16 B-scans, and 70.90 μm for 8 B-scans. For FCS thickness, Bland-Altman plots of the mean difference between the ground-truth and each sampling density are shown in Figure 4.
Figure 3.
Effect of reduced B-scan sampling density on measurements of foveal central subfield (FCS) thickness: (A) mean absolute error (μm), (B) mean percentage error.
Figure 4.
Bland-Altman plots demonstrating the level of agreement between the ground-truth and each sampling density for thickness of the foveal central subfield (FCS). (A) At a scanning density that included only every other B-scan (64 B-scans, with a spacing of 94 μm) the 95% limits of agreement were between −0.191 μm and 0.369 μm. (B) At a scanning density that included only every fourth B-scan (32 B-scans, with a spacing of 188 μm) the 95% limits of agreement were between −0.869 μm and 1.849 μm. (C) At a scanning density that included only every eighth B-scan (16 B-scans, with a spacing of 375 μm) the 95% limits of agreement were between −5.331 μm and 8.448 μm. (D) At a scanning density that included only every 16th B-scan (8 B-scans, with a spacing of 750 μm) the 95% limits of agreement were between −21.895 μm and 21.886 μm.
For the FCS thickness, the mean percentage error was 0.05 ± 0.04% with 64 B-scans (1/2), 0.25 ± 0.18% with 32 B-scans (1/4), 1.03 ± 0.82% with 16 B-scans (1/8), and 2.48 ± 2.32% with 8 B-scans (1/16) (Fig. 3B). The maximum percentage error was 0.27% for 64 B-scans, 0.80% for 32 B-scans, 4.01% for 16 B-scans, and 15.52% for 8 B-scans.
The mean thicknesses of the neurosensory retina at the FCS were 307.14 ± 119.33 μm (128 B-scans), 307.23 ± 119.26 μm (64 B-scans), 307.63 ± 119.07 μm (32 B-scans), 308.70 ± 118.00 μm (16 B-scans), and 307.13 ± 116.02 μm (8 B-scans). Increased FCS thickness (obtained using all 128 B-scans), showed modest, but statistically significant, correlations with increased percentage error at sampling densities of 32 B-scans (r = .1915, P = 0.040), 16 B-scans (r = .2256, P = 0.015), and 8 B-scans (r = .2645, P = 0.004). No statistically significant correlation was detected between FCS thickness (obtained using all 128 B-scans), and percentage error, at a sampling density of 64 B-scans (r = .0924, P = 0.326).
B-scan Sampling Density and Total Macular Volume
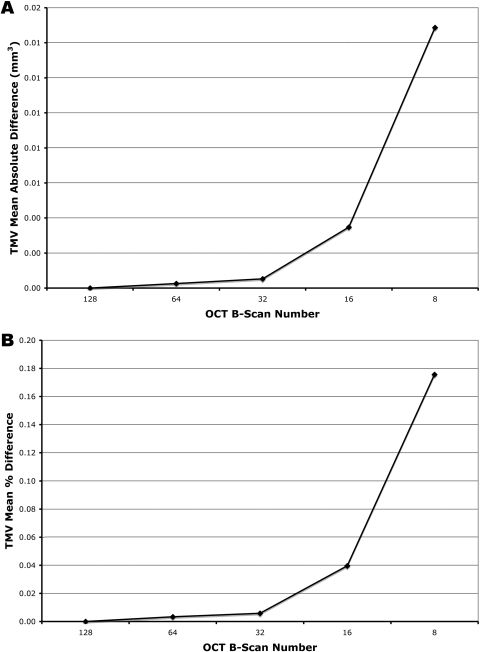
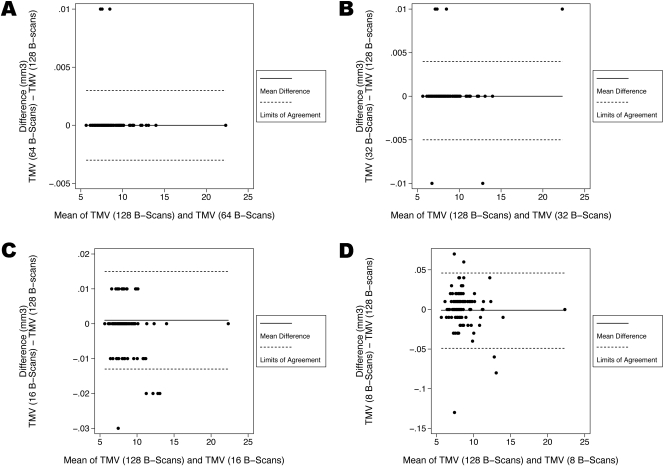
For the total macular volume, the mean absolute error was 0.000 ± 0.002 mm3 with 64 B-scans (1/2), 0.001 ± 0.002 mm3 with 32 B-scans (1/4), 0.003 ± 0.006 mm3 with 16 B-scans (1/8), and 0.015 ± 0.018 mm3 with 8 B-scans (1/16) (Fig. 5A). The maximum absolute error was 0.010 mm3 for 64 B-scans, 0.010 mm3 for 32 B-scans, 0.030 mm3 for 16 B-scans, and 0.130 mm3 for 8 B-scans. For the total macular volume, Bland-Altman plots of the mean difference between the ground-truth and each sampling density are shown in Figure 6.
Figure 5.
Effect of reduced B-scan sampling density on measurements of total macular volume (TMV): (A) mean absolute error (mm3), (B) mean percentage error.
Figure 6.
Bland-Altman plots demonstrating the level of agreement between the ground-truth and each sampling density for the total macular volume (TMV). (A) At a scanning density that included only every other B-scan (64 B-scans, with a spacing of 94 μm) the 95% limits of agreement were between −0.003 mm3 and 0.003 mm3. (B) At a scanning density that included only every fourth B-scan (32 B-scans, with a spacing of 188 μm) the 95% limits of agreement were between −0.005 mm3 and 0.004 mm3. (C) At a scanning density that included only every eightth B-scan (16 B-scans, with a spacing of 375 μm) the 95% limits of agreement were between −0.013 mm3 and 0.015 mm3. (D) At a scanning density that included only every 16th B-scan (8 B-scans, with a spacing of 750 μm) the 95% limits of agreement were between −0.049 mm3 and 0.046 mm3.
For the total macular volume, the mean percentage error was 0.003 ± 0.021% with 64 B-scans (1/2), 0.006 ± 0.026% with 32 B-scans (1/4), 0.040 ± 0.068% with 16 B-scans (1/8), and 0.176 ± 0.221% with 8 B-scans (1/16) (Fig. 5B). The maximum percentage error was 0.136% for 64 B-scans, 0.148% for 32 B-scans, 0.401% for 16 B-scans, and 1.738% for 8 B-scans.
Retinal Sampling Density and Disease
No statistically significant association was found between referring disease diagnosis and either the percentage, or the absolute, differences between each sampling density and the ground truth (data not shown).
Discussion
In this study, reduction in the scanning density of an SDOCT volume scan acquisition was associated with a progressive increase in the error of retinal thickness measurements. However, the magnitude of error was minimal until the scanning density was reduced to every eighth B-scan (ie, 16 B-scans, with an equal spacing of 375 μm)—at this point, the mean percentage error in FCS retinal thickness was approximately 1%, with a maximum error of approximately 4%. Similarly, total macular volume measurements were associated with minimal error until the OCT B-scan density was reduced to every eighth scan of the Macular Cube protocol. In contrast, at a scanning density of every fourth B-scan (32 B-scans, with a spacing of 188 μm), the maximum error in FCS retinal thickness was <1%.
These observations have relevance for the design of clinical trials of retinal disease incorporating SDOCT. In these trials, retinal thickness measurements—in particular FCS retinal thickness—serve as anatomic outcome parameters.2,3 To ensure the accuracy of these measurements, ophthalmic image reading centers commonly perform manual correction of errors in the retinal boundary segmentation.11,21 Manual correction of such errors is feasible in the context of time domain OCT (eg, Stratus OCT), where typically only six radially oriented B-scans are acquired.18,20 Manual correction may be impractical, however, with SDOCT datasets, where 128 (or more) B-scans are commonly obtained.17,22 In the current report, a sampling density of every fourth B-scan was associated with minimal error—at such a density, only the central six B-scans actually contribute to the calculation of FCS thickness. Thus, reading center correction of SDOCT datasets obtained at this sampling density would appear both feasible and clinically relevant.
The requirement of fewer B-scans for the accurate generation of retinal thickness maps has other potential benefits for the design of SDOCT acquisition protocols in clinical trials. Although commercial SDOCT instruments are 40 to 100 times faster than Stratus OCT, eye movement artifacts (eg, vertical microsaccades) can still occur, and lead to inaccuracies or inconsistencies in retinal thickness maps.1,23–25 Cirrus HD-OCT, for example, requires 2 seconds to procure all 128 B-scans of the Macular Cube protocol. If only 32 B-scans were required, however, image acquisition would be completed in 0.5 seconds, further reducing the risk of eye movement artifact. Some SDOCT instruments, such as the Spectralis OCT (Heidelberg Engineering, Inc., Vista, CA), use eye tracking to address this issue.26,27 In patients with significant eye disease and poor fixation, however, tracking of eye movements can result in prolonged acquisition times and ultimately limit the density of scans that can be acquired. Thus, our finding is also of relevance to these tracking-enabled devices, and may allow for the utilization of uniform scanning protocols across SDOCT devices.
Use of raster scan protocols with a lower sampling density may also facilitate increased implementation of OCT B-scan averaging, a feature of many SDOCT instruments.28,29 The rapid scanning of SDOCT allows multiple B-scans to be averaged, thus reducing speckle noise and allowing detailed visualization of fine structures. This improved image quality is particularly important for delineating faint structures in the outer retina, such as the external limiting membrane, or different components of choroidal neovascular lesions, and may allow more accurate automated segmentation of retinal boundaries.30,31 Alternatively, if B-scan averaging is not available, OCT images may be acquired so that the transverse pixel density of individual B-scans is far in excess of that required to achieve the maximum optical transverse resolution.32 Cirrus HD-OCT applies this technique when acquiring the “High Definition 5 Line Raster Protocol” (Fig. 1A). This feature enables selected parts of the image to be enlarged without excessive pixelation, but should not be confused with an increased transverse resolution of the OCT image itself.
Our study has a number of limitations—in particular, our findings are limited to a single SDOCT system: Cirrus HD-OCT by Carl Zeiss Meditec. While we believe that these findings may be applicable to other SDOCT systems, further study will be required to confirm this hypothesis. In addition, since we limited the study to cases with good segmentation, complex cases such as those with AMD (only 22) were relatively underrepresented. Although we did not find an association between mean error values and disease diagnosis, our study was not adequately powered to ascertain this with certainty. Furthermore, while the results of this study suggest that less dense sampling may be sufficient for the generation of retinal thickness maps, it is important to note that our findings do not imply that less dense sampling is sufficient for all aspects of clinical trials or clinical practice. For example, it is not clear whether less dense sampling will be sufficient for sub-analyses of specific structures or compartments such as quantifying zones of subretinal fluid or pigment epithelial detachments. Also, quantitative data are only one facet of OCT used by clinicians. Qualitative assessment of OCT data and identification of clinically relevant features such as retinal cysts, subretinal fluid, and pigment epithelial detachments, is a common clinical application of OCT.12 It is possible that less-dense sampling could reduce the sensitivity for detecting these features, with a potentially deleterious effect on patient care.33 This issue requires further study. It is possible that the optimum scanning density for qualitative assessment may be disease-specific, and a variety of different scanning patterns may be required for clinical practice. In the interim, when designing SDOCT acquisition protocols for use in clinical trials, we would recommend considering more dense scans for qualitative assessments and less dense scans for calculation of quantitative parameters, particularly when manual correction is expected to be necessary.
Footnotes
Supported in part by NIH Grant EY03040 and NEI Grant R01 EY014375. The Doheny Image Reading Center also received research support from Carl Zeiss Meditec and Optovue, Inc.
Disclosure: S.R. Sadda, Heidelberg Engineering, Inc. (C), P; P.A. Keane, None; Y. Ouyang, None; J.F. Updike, None; A.C. Walsh, Heidelberg Engineering, Inc. (C), P
References
- 1.Drexler W, Fujimoto JG. State-of-the-art retinal optical coherence tomography. Prog Ret Eye Res 2008; 27: 45–88 [DOI] [PubMed] [Google Scholar]
- 2.Keane PA, Liakopoulos S, Jivrajka RV, et al. Evaluation of optical coherence tomography central retinal thickness parameters in clinical trials for neovascular age-related macular degeneration. Invest Ophthalmol Vis Sci 2009; 50: 3378–3385 [DOI] [PubMed] [Google Scholar]
- 3.Keane PA, Sadda SR. Optical coherence tomography in the diagnosis and management of diabetic retinopathy. Int Ophthalmol Clin 2009; 49: 61–74 [DOI] [PubMed] [Google Scholar]
- 4.Hee MR, Puliafito CA, Wong C, et al. Quantitative assessment of macular edema with optical coherence tomography. Arch Ophthalmol 1995; 113: 1019–1029 [DOI] [PubMed] [Google Scholar]
- 5.Ghazi NG, Kirk T, Allam S, Yan G. Quantification of error in optical coherence tomography central macular thickness measurement in wet age-related macular degeneration. Am J Ophthalmol 2009; 148: 90–96.e2 [DOI] [PubMed] [Google Scholar]
- 6.Krebs I, Falkner-Radler C, Hagen S, et al. Quality of the threshold algorithm in age-related macular degeneration: Stratus versus Cirrus OCT. Invest Ophthalmol Vis Sci 2009; 50: 995–1000 [DOI] [PubMed] [Google Scholar]
- 7.Patel PJ, Chen FK, da Cruz L, Tufail A. Segmentation error in Stratus optical coherence tomography for neovascular age-related macular degeneration. Invest Ophthalmol Vis Sci 2009; 50: 399–404 [DOI] [PubMed] [Google Scholar]
- 8.Keane PA, Mand PS, Liakopoulos S, Walsh AC, Sadda SR. Accuracy of retinal thickness measurements obtained with Cirrus optical coherence tomography. Br J Ophthalmol 2009July1;[Epub ahead of print]. [DOI] [PubMed] [Google Scholar]
- 9.Moutray T, Alarbi M, Mahon G, Stevenson M, Chakravarthy U. Relationships between clinical measures of visual function, fluorescein angiographic and optical coherence tomography features in patients with subfoveal choroidal neovascularisation. Br J Ophthalmol 2008; 92: 361–364 [DOI] [PubMed] [Google Scholar]
- 10.Spaide RF, Laud K, Fine HF, et al. Intravitreal bevacizumab treatment of choroidal neovascularization secondary to age-related macular degeneration. Retina 2006; 26: 383–390 [DOI] [PubMed] [Google Scholar]
- 11.Glassman A, Beck R, Browning DJ, Danis R, Kollman Cfor The Diabetic Retinopathy Clinical Research Network Study Group. Comparison of optical coherence tomography in diabetic macular edema, with and without reading center manual grading from a clinical trials perspective. Invest Ophthalmol Vis Sci 2009; 50: 560–566 [DOI] [PMC free article] [PubMed] [Google Scholar]
- 12.Keane PA, Bhatti RA, Brubaker JW, Liakopoulos S, Sadda SR, Walsh AC. Comparison of clinically relevant findings from high-speed fourier-domain and conventional time-domain optical coherence tomography. Am J Ophthalmol 2009; 148: 242–248.e1 [DOI] [PMC free article] [PubMed] [Google Scholar]
- 13.Schuman JS, Puliafito CA, Fujimoto JG. Optical Coherence Tomography of Ocular Diseases 2nd ed.Thorofare, NJ: Slack; 2004 [Google Scholar]
- 14.Hee MR, Puliafito CA, Duker JS, et al. Topography of diabetic macular edema with optical coherence tomography. Ophthalmology 1998; 105: 360–370 [DOI] [PMC free article] [PubMed] [Google Scholar]
- 15.Ahlers C, Simader C, Geitzenauer W, et al. Automatic segmentation in three-dimensional analysis of fibrovascular pigment epithelial detachment using high-definition optical coherence tomography. Br J Ophthalmol 2008; 92: 197–203 [DOI] [PubMed] [Google Scholar]
- 16.Legarreta JE, Gregori G, Punjabi OS, Knighton RW, Lalwani GA, Puliafito CA. Macular thickness measurements in normal eyes using spectral domain optical coherence tomography. Ophthalmic Surg Lasers Imaging 2008; 39: S43–S49 [DOI] [PubMed] [Google Scholar]
- 17.Ahlers C, Golbaz I, Stock G, et al. Time course of morphologic effects on different retinal compartments after ranibizumab therapy in age-related macular degeneration. Ophthalmology 2008; 115: e39–46 [DOI] [PubMed] [Google Scholar]
- 18.Joeres S, Tsong JW, Updike PG, et al. Reproducibility of quantitative optical coherence tomography subanalysis in neovascular age-related macular degeneration. Invest Ophthalmol Vis Sci 2007; 48: 4300–4307 [DOI] [PubMed] [Google Scholar]
- 19.Keane PA, Liakopoulos S, Chang KT, et al. Relationship between optical coherence tomography retinal parameters and visual acuity in neovascular age-related macular degeneration. Ophthalmology 2008; 115: 2206–2214 [DOI] [PMC free article] [PubMed] [Google Scholar]
- 20.Sadda SR, Joeres S, Wu Z, et al. Error correction and quantitative subanalysis of optical coherence tomography data using computer-assisted grading. Invest Ophthalmol Vis Sci 2007; 48: 839–848 [DOI] [PubMed] [Google Scholar]
- 21.Browning DJ, Glassman AR, Aiello LP, et al. ; Diabetic Retinopathy Clinical Research Network. Optical coherence tomography measurements and analysis methods in optical coherence tomography studies of diabetic macular edema. Ophthalmology 2008; 115: 1366–1371.e1 [DOI] [PMC free article] [PubMed] [Google Scholar]
- 22.Kiss C, Geitzenauer W, Simader C, Gregori G, Schmidt-Erfurth U. Evaluation of ranibizumab-induced changes of high-resolution optical coherence tomographic retinal morphology and their impact on visual function. Invest Ophthalmol Vis Sci 2009; 50: 2376–2383 [DOI] [PubMed] [Google Scholar]
- 23.Ferguson RD, Hammer DX, Paunescu LA, Beaton S, Schuman JS. Tracking optical coherence tomography. Opt Lett 2004; 29: 2139–2141 [DOI] [PMC free article] [PubMed] [Google Scholar]
- 24.Hammer DX, Ferguson RD, Magill JC, et al. Active retinal tracker for clinical optical coherence tomography systems. J Biomed Opt 2005; 10: 024038 [DOI] [PMC free article] [PubMed] [Google Scholar]
- 25.Ip LP, Nguyen TQ, Bartsch DU. Fundus based eye tracker for optical coherence tomography. Conf Proc IEEE Eng Med Biol Soc 2004; 2: 1505–1508 [DOI] [PubMed] [Google Scholar]
- 26.Grover S, Murthy RK, Brar VS, Chalam KV. Normative data for macular thickness by high-definition spectral-domain optical coherence tomography (Spectralis). Am J Ophthalmol 2009; 148: 266–271 [DOI] [PubMed] [Google Scholar]
- 27.Menke MN, Dabov S, Knecht P, Sturm V. Reproducibility of retinal thickness measurements in healthy subjects using Spectralis optical coherence tomography. Am J Ophthalmol 2009; 147: 467–472 [DOI] [PubMed] [Google Scholar]
- 28.Hangai M, Yamamoto M, Sakamoto A, Yoshimura N. Ultrahigh-resolution versus speckle noise-reduction in spectral-domain optical coherence tomography. Opt Express 2009; 17: 4221–4235 [DOI] [PubMed] [Google Scholar]
- 29.Sakamoto A, Hangai M, Yoshimura N. Spectral-domain optical coherence tomography with multiple B-scan averaging for enhanced imaging of retinal diseases. Ophthalmology 2008; 115: 1071–1078.e7 [DOI] [PubMed] [Google Scholar]
- 30.Spaide RF. Enhanced depth imaging optical coherence tomography of retinal pigment epithelial detachment in age-related macular degeneration. Am J Ophthalmol 2009; 147: 644–652 [DOI] [PubMed] [Google Scholar]
- 31.Spaide RF, Koizumi H, Pozonni MC. Enhanced depth imaging spectral-domain optical coherence tomography. Am J Ophthalmol 2008; 146: 496–500 [DOI] [PubMed] [Google Scholar]
- 32.van Velthoven ME, Faber DJ, Verbraak FD, van Leeuwen TG, de Smet MD. Recent developments in optical coherence tomography for imaging the retina. Prog Ret Eye Res 2007; 26: 57–77 [DOI] [PubMed] [Google Scholar]
- 33.Sayanagi K, Sharma S, Yamamoto T, Kaiser PK. Comparison of spectral-domain versus time-domain optical coherence tomography in management of age-related macular degeneration with ranibizumab. Ophthalmology 2009; 116: 947–955 [DOI] [PubMed] [Google Scholar]


