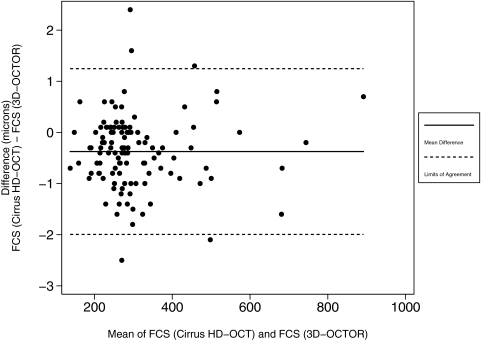
Figure 2.
Bland-Altman plot demonstrating level of agreement between the Cirrus HD-OCT and 3D-OCTOR interpolation methods for the foveal central subfield (FCS). Solid horizontal line: the simple mean difference (−0.374 μm); dashed horizontal lines: the 95% limits of agreement (−1.995 μm to +1.247 μm).

