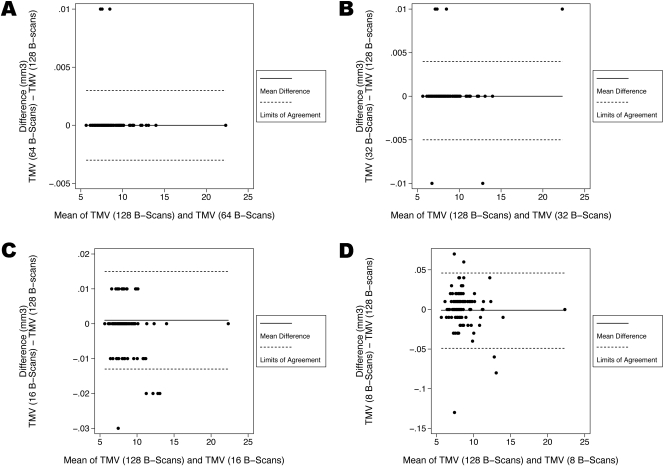
Figure 6.
Bland-Altman plots demonstrating the level of agreement between the ground-truth and each sampling density for the total macular volume (TMV). (A) At a scanning density that included only every other B-scan (64 B-scans, with a spacing of 94 μm) the 95% limits of agreement were between −0.003 mm3 and 0.003 mm3. (B) At a scanning density that included only every fourth B-scan (32 B-scans, with a spacing of 188 μm) the 95% limits of agreement were between −0.005 mm3 and 0.004 mm3. (C) At a scanning density that included only every eightth B-scan (16 B-scans, with a spacing of 375 μm) the 95% limits of agreement were between −0.013 mm3 and 0.015 mm3. (D) At a scanning density that included only every 16th B-scan (8 B-scans, with a spacing of 750 μm) the 95% limits of agreement were between −0.049 mm3 and 0.046 mm3.

