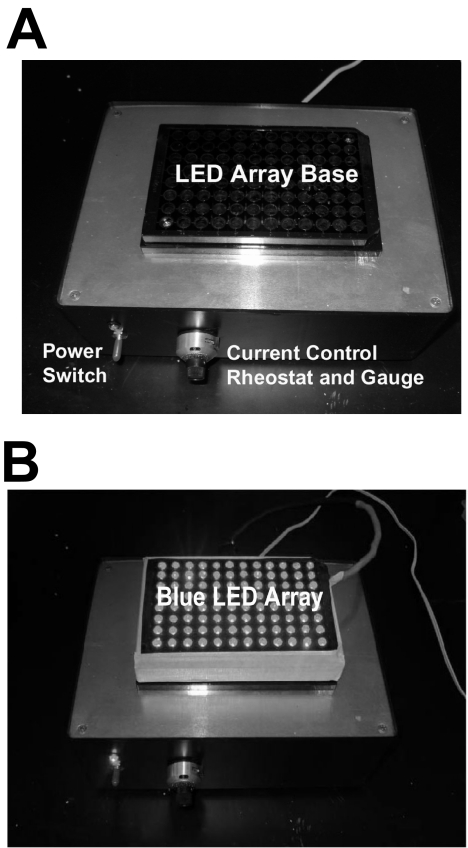
Figure 1.
(A) The LED array driver. The power switch (blue LED indicator) and the current control rheostat and dial gauge monitor are labeled. (B) A representative operational blue (470 nm) LED diode array in operation is situated on the control box with optical output near maximum intensity (shown in black and white). A cell culture 96-well array is not present in this image, to allow best visualization of the positioning of the individual LEDs in the array. In most experiments, the cell culture array sat immediately on top of the LED array, whereas in other experiments the energy was concentrated with an intermediate ball lens array that was positioned between the LED array and the cell culture array.

