Figure 6.
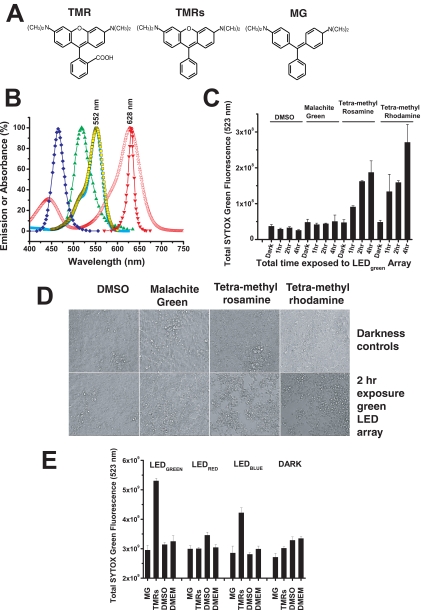
Small-molecule phototoxicity elicited by LED arrays. (A) Chemical structures of TMR, TMRs, and MG. (B) The absorption (excitation) spectra of TMR (peak 552 nm), TMRs (peak 552 nm), and MG (peak 628 nm) are shown relative to the spectral output of the LED470 nm blue array (peak 465 nm), the LED525 nm green array (peak 518 nm), and the LED625 nm red array (peak 631 nm). The absorption spectra of TMR and TMRs overlap with the optical stimulus spectra of the LED green array and in part with the LED blue array, indicating that these arrays have the potential to induce phototoxicity from TMR and TMRs, but not from MG. (C) SYTOX Green cytotoxicity assay after exposure of cells to TMR, TMRs, or MG (all at 1 μM) followed by exposure to the highest intensity of the green LED525 nm array for 1, 2, or 4 hours. Increases in the SYTOX Green fluorescence indicates increased cell death. The DMSO control (at 0.2%; vol/vol) has the solvent at the same concentration delivered into the cell culture media for the three test chemicals. Dark controls were not illuminated with LED light. ANOVA of all the samples led to the outcome that the means were not the same (F = 13.12, P = 1.17E-9). ANOVA tests run over the four sets of the chemical test substances found that the means were not different for the various test conditions for DMSO (F = 2.12, P = 0.18), or MG (F = 0.154, P = 0.92), but they were different for the various test conditions for TMRs (F = 14.87, P = 0.001) and TMR (F = 6.91, P = 0.01). These data suggest that TMRs and TMR are both photoactive chemicals that promote cellular apoptosis under the conditions of light exposure. Further statistical testing was performed on this hypothesis by comparing all samples of the different chemicals in the same condition (dark and 1, 2, and 4 hours of light exposure). ANOVA of all the dark samples found no differences among the sample means (F = 0.62, P = 0.62). ANOVA on all the 1-hour samples also found no difference among the sample means, although the probability was close to statistical criterion level (α = 0.05) (F = 3.86, P = 0.06), most likely due to the TMRs and TMR samples at the 1-hour exposure. ANOVA of the 2- and 4 hour samples found strong differences between the sample means (2 hour: F = 453.41, P = 2.87E-9; 4-hour: F = 14.04, P = 0.001). The progress of the statistical analysis suggested that the TMRs and TMR both induced cellular phototoxicity at both the 2- and 4-hour doses of light. The TMRs and TMR samples at 2 and 4 hours were then both tested (t-test) relative to their dark controls (TMRs: 2 hours [t = 13.80, P = 1.60E-4] and 4 hours [t = 4.22, P = 0.01] versus dark control; TMR: 2 hours [t = 14.75, P = 1.23E-4] and 4 hours [t = 4.45, P = 0.01] versus dark control), and the results showed that both TMRs and TMR promote cellular phototoxicity over a 1- to 4-hour period when exposed to light with energy overlapping the absorption dipole of these agents. (D) Representative microscopic cell culture images (phase contrast) of samples from TMR, TMRs, MG, and DMSO control cultures that were kept in the dark (top row) versus samples that were exposed to the LED525 nm green array at maximum intensity for 2 hours (bottom row). Only the cells that received TMR or TMRs and light of the appropriate wavelength exhibited cytotoxicity. (E) Toxicities of TMRs and MG were measured on the blue (470 nm), green (525 nm), and red (625 nm) LED arrays after 2-hour exposures followed by SYTOX Green staining. ANOVA was performed on all data sample sets for each LED array and the darkness control. The means were found to be significantly different for the green (F = 62.89, P = 1.31E-7), red (F = 5.71, P = 0.01), and blue (F = 18.43, P = 8.69E-5) LED arrays and, surprisingly, for the darkness control (F = 8.34, P = 0.003). With DMSO used as the pertinent sample, control t-tests were performed to compare means within sample sets from the LED arrays and darkness control. On the green LED array MG did not show significant toxicity (t = 1.07, P = 0.32), whereas TMRs showed significant toxicity (t = −19.00, P = 1.37E-6) compared with DMSO. On the red LED array both MG and TMRs show significant difference in toxicity compared with DMSO, but both induced mean toxicities that were lower than the control (MG versus DMSO: t = 3.04, P = 0.0227; TMRs versus DMSO: t = 3.97, P = 0.0074), and there was no significant difference between MG and TMRs (t = 0.067, P = 0.95). On the blue LED array MG showed no significant toxicity relative to DMSO (t = 0.1884, P = 0.86), whereas TMRs showed significant toxicity relative to DMSO (t = −7.76, P = 2.40E-4) and MG (t = 4.69, P = 0.003). In the darkness control MG showed a lower mean value than DMSO control (t = 3.18, P = 0.02), but the TMRs versus DMSO (t = 2.06, P = 0.085) and the TMRs versus MG (t = 2.10, P = 0.08) showed no differences. In summary, there was significant toxicity of TMRs on both the LED525 nm and LED470 nm arrays, but not the LED625 nm red array. MG showed no significant toxicity on any of the LED arrays. To power the LED470 nm array, a constant voltage of 12 V DC and output current 1.0 A (12 W) was used; for the LED525 nm array, a constant voltage of 12 V DC and output current 0.80 A (9.8 W); and for the LED625 nm array, a constant voltage of 12 V DC and output current of 0.63 A (7.6 W) was used.

