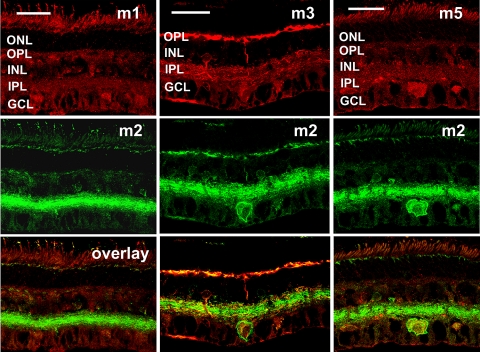
Figure 9.
Pair-wise comparisons of m1, m3, and m5 immunoreactivity relative to that of m2. Maximum projection images of five optical confocal sections shows immunoreactivity to m1, m3, and m5 (top row) relative to m2 immunoreactivity (middle row). There was very limited colocalization between m1 and m2 (left). Subsets of bipolar, amacrine, and ganglion cells expressed both m3 and m2 (middle), whereas only cells in the GCL expressed both m5 and m2 (right). Confocal images of five optical sections were obtained in 0.5-μm intervals. Scale bar, 32 μm.

