Figure 2.
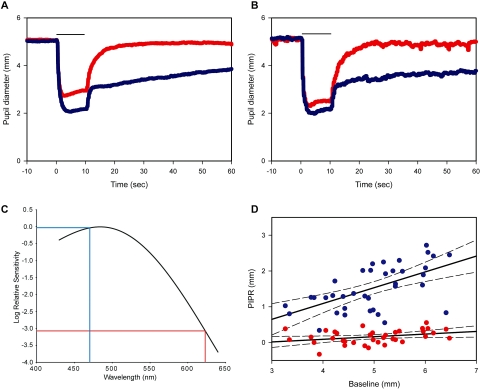
Time trace plots of the pupillary response to the control (red) and test (blue) LEDs (n = 37). Bar, light stimulus duration. The red and blue traces depict the pupil diameter for the red and blue lights, respectively. (A) Average pupil diameter plotted against time in all subjects. (B) Maximum response for red light generated by increasing the retinal irradiance by half a log unit. Average pupil diameter plotted against time in five subjects. (C) Spectral sensitivity nomogram for melanopsin showing the expected relative PIPR sensitivity for the 470 nm (blue trace) and 623 nm (red trace) stimuli. (D) Linear regression plots for the control (red circles, R2 = 0.157) and test (blue circles, R2 = 0.354) with 95% confidence interval (CI; dashed lines). Baseline pupil diameters are plotted against the PIPRs (n = 37).

