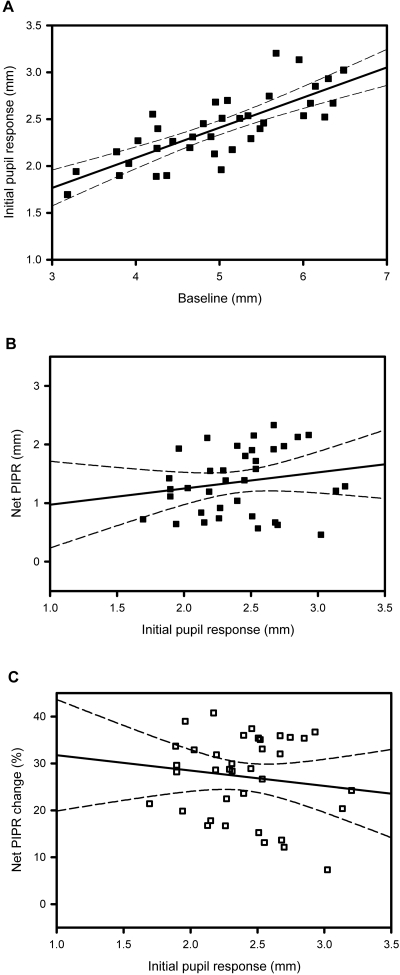
Figure 5.
Correlation between baseline pupil diameter, net PIPR, and the initial pupil responses. Regression plots show linear trend lines (solid line) and 95% CI (dashed lines). (A) Initial pupil response plotted against baseline pupil diameter (R2 = 0.612, P < 0.001) = 0.419 + (1.901 × initial pupil response). (B) Net PIPR plotted as a function of initial pupil response (R2 = 0.033, P > 0.05) = 0.697 + (0.276 × initial pupil response). (C) Net PIPR change plotted against initial pupil response (R2 = 0.018, P > 0.05) =35.0 + (−3.271 × initial pupil response). P values are for the slopes of the regression lines.

