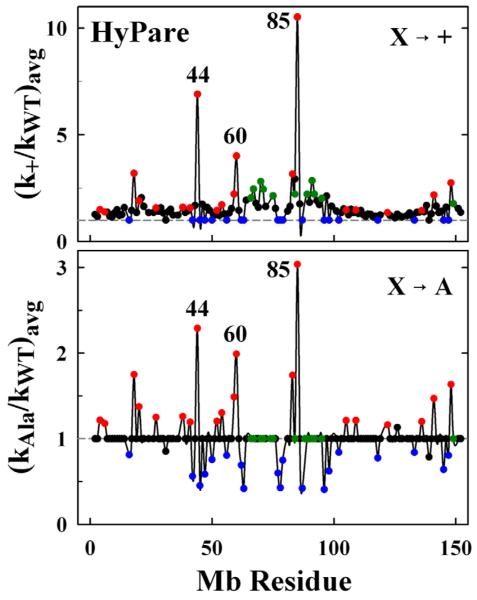
Fig 5.
Rate enhancement ratios (kon/kWT) from HyPARE as a function of residue position for X → + (upper) and X →A (lower) mutations. Dashed line corresponds to ratio for Mb(WT). Symbol colors designate the type of residue: D/E (red); K (blue); neutral front-face residues (green); neutral residues not included in the BD profile (black).

