
Fig. 6.
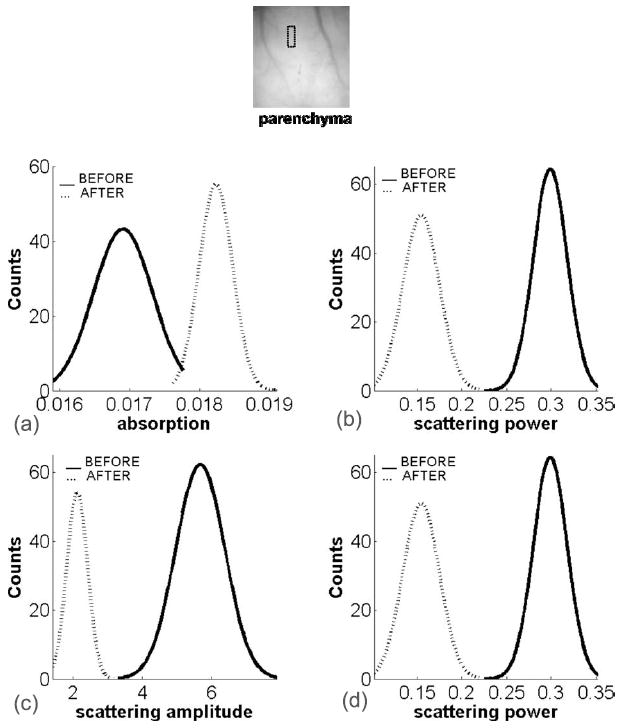
(a) and (b) Absorption and (c) and (d) scattering property histograms before (solid lines) and after (dashed lines) MCAo for the parenchyma. The small box denotes the ROI used for analysis.
Official websites use .gov
A
.gov website belongs to an official
government organization in the United States.
Secure .gov websites use HTTPS
A lock (
) or https:// means you've safely
connected to the .gov website. Share sensitive
information only on official, secure websites.
(a) and (b) Absorption and (c) and (d) scattering property histograms before (solid lines) and after (dashed lines) MCAo for the parenchyma. The small box denotes the ROI used for analysis.