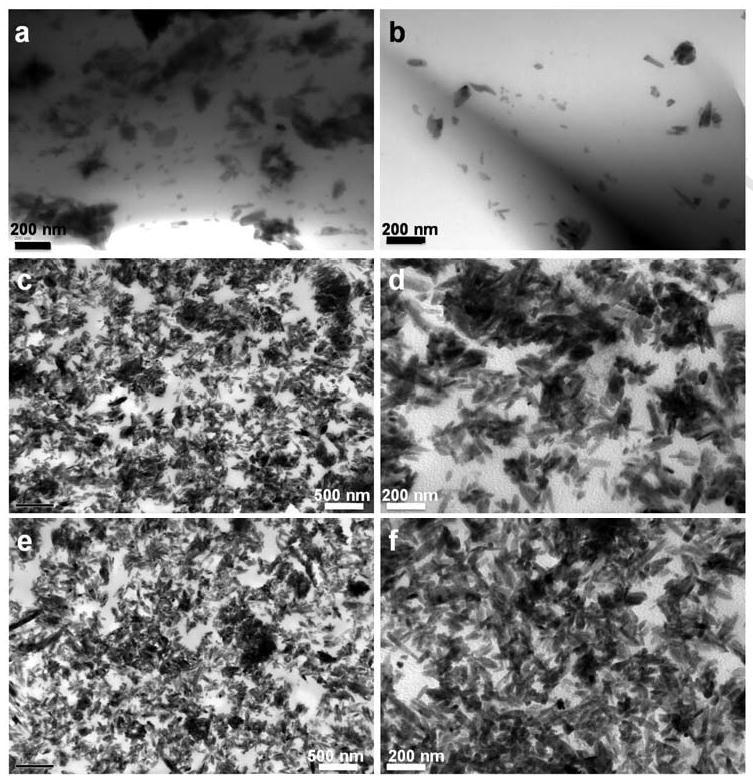
Fig. 1.

Transmission electron micrographs of the cross sections (a, b) of a crosslinked PCLF2000/HA 5% disk, and the cross section (c, d) and horizontal section (e, f) of a crosslinked PCLF2000/HA 30% disk. The images in d and f are magnified from the images in c and e, respectively. Scale bars represent 200 nm (a, b, d, f) and 500 nm (c, e).
