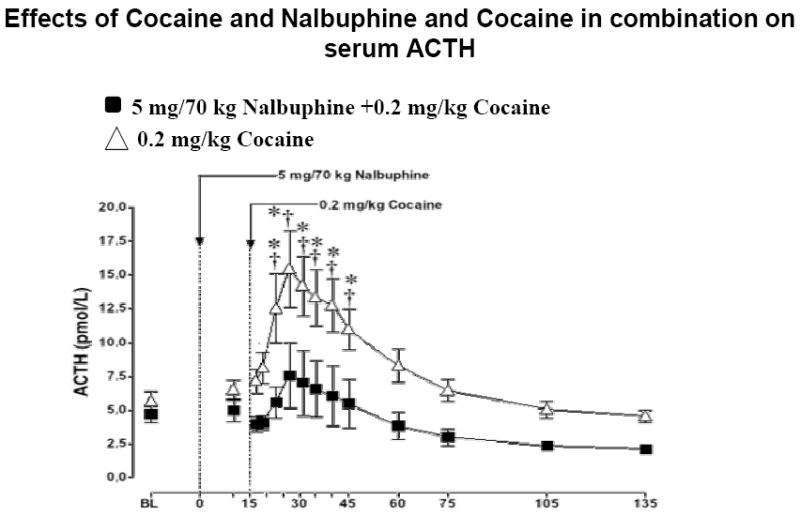
Fig. 2.

Plasma ACTH levels after i.v. administration of 5 mg/70kg nalbuphine and of 0.2 mg/kg cocaine. Significant changes from the baseline are indicated by daggers (†, P=0.001-0.02). Asterisks (*, P<0.05) indicate points at which ACTH levels differed between subjects who received 0.2 mg/kg cocaine or a combination of 5 mg/70 kg nalbuphine and 0.2 mg/kg cocaine.
