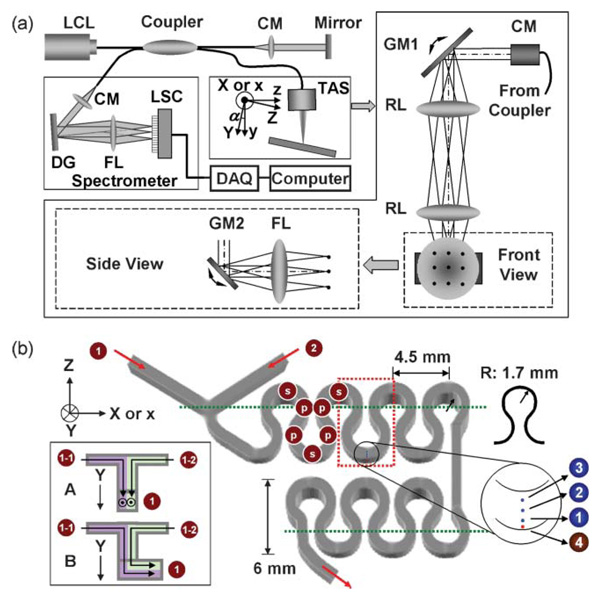
Fig. 2.
Experimental setup. (a) Schematic diagram for spectral-domain Doppler optical coherence tomography, and (b) a meandering square microchannel: ( ) area of interest; (
 ) line of interest; (
 ) point of interest; LCL: low-coherence light; CM: collimator; DG: diffraction grating; FL: focusing lens; LSC: line scan camera; GM: galvo mirror; RL: relay lens, TAS: two-axis scanner.

