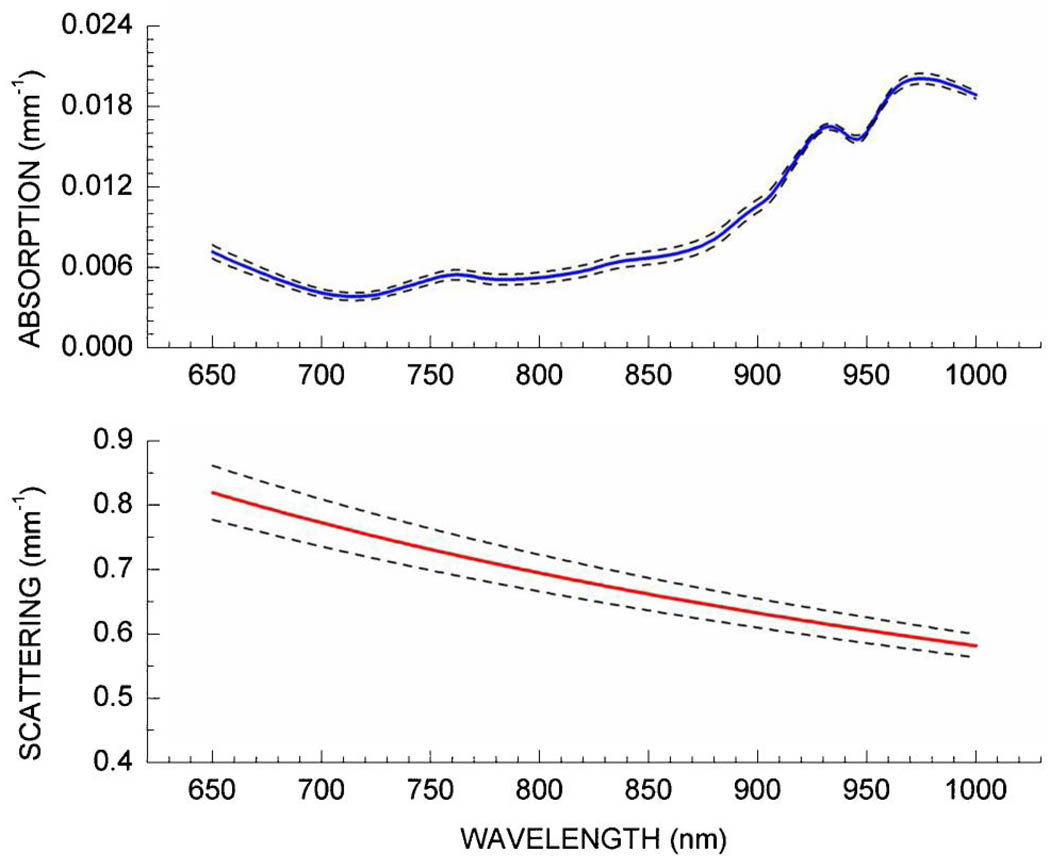
Fig. 2.
(Color online) DOS absorption and reduced scattering spectra measured as a function of probe–breast contact force in a single normal subject. The solid lines represent the average spectrum for all pressures (N = 7), while the dashed lines represent the standard deviation of the average. Note that over the typical range of contact forces measured in the breasts of eight patients, absorption and reduced scattering coefficients (650 to 1000 nm) variance was 3.1 ± 1.0% and 1.0 ± 0.4%, respectively.

