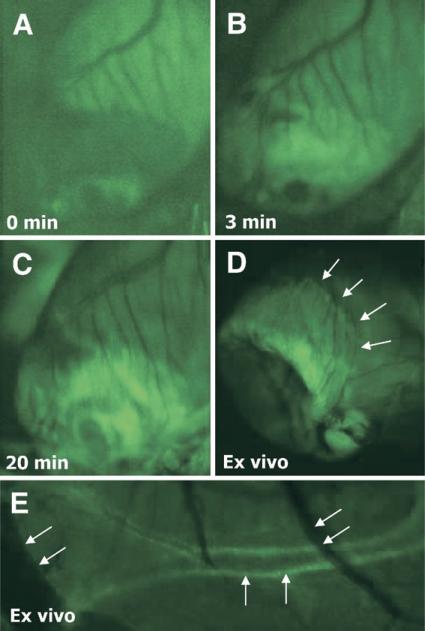
Figure 2. Optical Imaging of AT Receptors.
Intravital microscopy images show a 3-week old MI in the murine heart failure model from baseline (A), and 3 min (B), and at 20 min (C) after administration of green fluorescent angiotensin peptide analog (APA), demonstrating gradual increase of the fluorescent APA in infarcted region. Fluorescent uptake was maximized at 20 min after intravenous APA injection. The ex vivo image (D), demonstrates APA uptake in the border zone, as thinned out infarct zone has collapsed and is therefore not visible. Panel E shows APA uptake in smooth muscle cell layer of a small coronary artery (vertical arrows) as well as minimal uptake in thinner veins (diagonal arrows)

