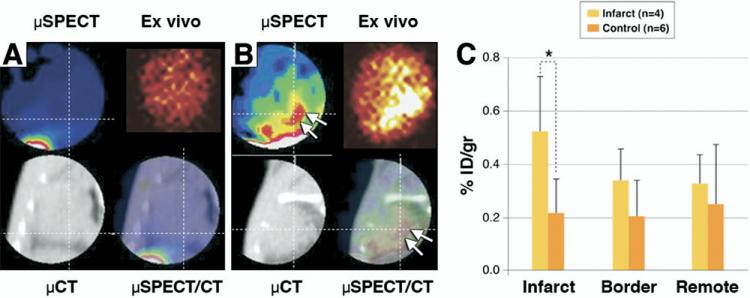
Figure 5. Noninvasive Imaging of AT Receptors With Radiolabeled Losartan.
The micro–SPECT and micro-CT images are shown in a control mouse after technetium Tc-99m losartan administration; no uptake in the heart can be seen (A) in the in vivo and ex vivo images. There is only some liver uptake on the bottom left of the SPECT image. (B) In the 3-week post-MI animal, significant radiolabeled losartan uptake is observed in the anterolateral wall (arrows) The infarct uptake on the in vivo image is confirmed in the ex vivo image. The histogram (C) demonstrates significantly (*) higher uptake in the infarcted region (0.524 ± 0.212% ID/g) as compared to control noninfarcted animals (0.215 ± 0.129% ID/g; p < 0.05). ID = injected dose.

