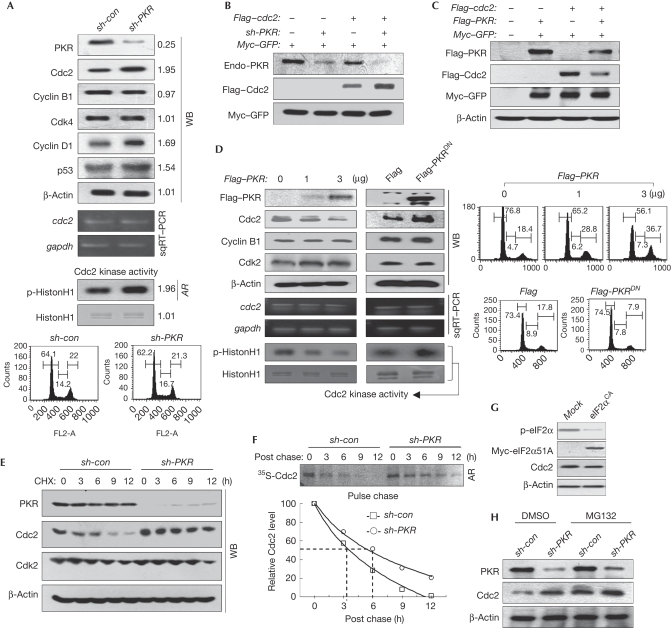
Figure 1.
PKR downregulates Cdc2. (A) Cell extracts of PKR-normal (sh-con) or PKRKD (sh-PKR) HEK293 cells were subjected to WB analysis (top). The mRNA level was assessed by sqRT–PCR (upper middle). Cdc2-associated kinase activity was assessed as described in the supplementary information online (lower middle). Relative band intensities were assessed through MCID analysis software (www.mcid.co.uk). sh-con or sh-PKR HEK293 cells were subjected to cell cycle analysis after PI staining (bottom). (B) PKR-normal (sh-PKR−) or PKRKD (sh-PKR+) HEK293 cells were transfected with Flag–cdc2 plasmid, together with Myc–GFP control, and were subjected to WB analysis. (C) Cdc2 levels in HEK293 cells, co-transfected with the plasmid combinations, were assessed. (D) HEK293 cells transfected with an increasing amount of Flag–PKR (left) or 3 μg of Flag–PKR/K296R (PKRDN, right) plasmids were subjected to WB analysis (top), sqRT–PCR (middle), Cdc2-associated kinase assay (bottom) and flow cytometry after PI staining (right). (E) The stability of Cdc2 was assessed in sh-con and sh-PKR HEK293 cells cultured in the presence of 75 μM CHX. (F) The stability of Cdc2 was assessed by pulse chase experiments as described in the supplementary information online (top). Relative band intensity was quantified with ImageJ software (http://rsbweb.nih.gov/ij; bottom). (G,H) Cdc2 levels were assessed in eIF2αCA HEK293 cells (G) and in sh-con and sh-PKR HEK293 cells that were treated with or without MG132 for 5 h before collection (H). AR, autoradiogram; Cdc2, cell division cycle 2; CHX, cycloheximide; DMSO, dimethyl sulphoxide; eIF2αCA, eukaryotic initiation factor 2α constitutively active; GFP, green fluorescent protein; HEK, human embryonic kidney; mRNA, messenger RNA; PI, propidium iodide; PKR(KD), double-stranded RNA-activated protein kinase (knockdown); sqRT–PCR, semi-quantitative reverse transcriptase PCR; WB, western blot.

