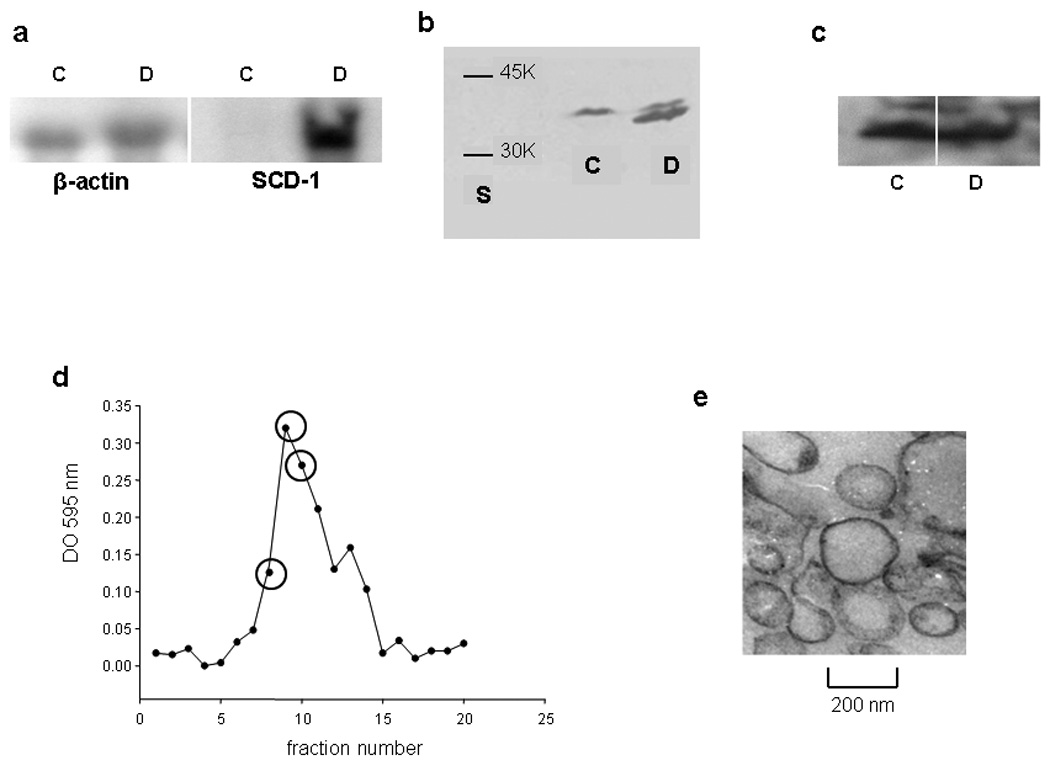
Figure 1. SCD-cell line characterization.

a) Overexpression of SCD determined by Northern blot: Twenty µg of total RNA were loaded in each well and SCD overexpression (symbol D) respect to the control (symbol C) was determined by comparison with β-actin as described in Methods. b) Protein levels of SCD detected by western blot. One hundred fifty µg of total protein of the membrane pellet was resuspended in sample buffer containing SDS and β mercaptoethanol, boiled and resolved in a homogeneous 12 % gel with 10 % SDS. Lane S corresponds to molecular weight markers. c) ABCA1 protein levels were detected in a similar manner. Samples without boiling treatment were separated in a 4–15% gradient gel containing SDS. d) Typical elution profile obtained for membrane purification. Each 200 µL from the top of the Nicodenz-Ficoll gradient were tested for protein content (Bradford, 1976). Fractions labeled with an empty circle were pooled and further analyzed to confirm the presence and purity of plasma membrane. e) Transmission electron micrograph of the isolated plasma membrane fraction. Magnification 20 K.
