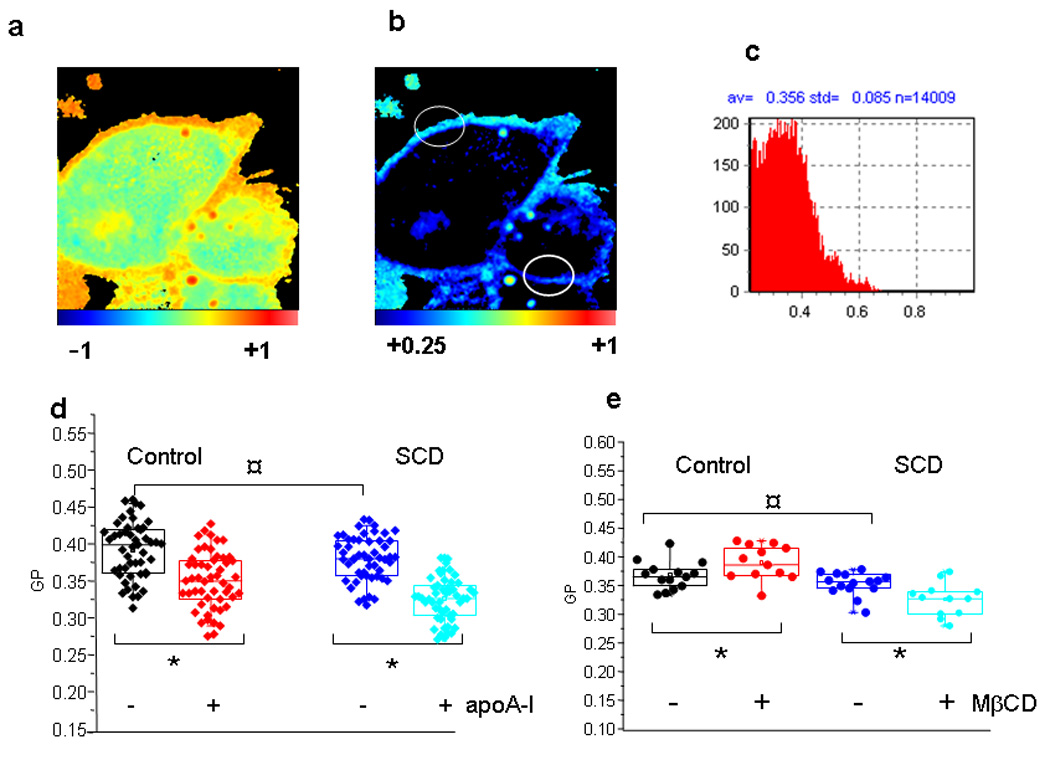
Figure 3. Laurdan GP two-photon fluorescence microscopy of CHO cells.

a) Cells were grown as described previously, and stained with Laurdan for 15 minutes. Laurdan GP images were taken as described, focusing at the middle plane of the cell. b) The same figure than a), but with a modification in the color scale, to eliminate the interference of pixels with lower GP values (from the Laurdan solubilized into the cytoplasm) (see scale at the bottom of the figure). Empty white circles symbolize the selected areas for GP analysis. Each histogram of GP values of these areas (represented in c), is used to calculate the experimental data shown in panels d and e. e) Experimental values of GP at the plasma membrane in unperturbed Control (black) and SCD-cells (blue symbols). Box-Charts show minimum, 25th percentile, median and 75th percentile values. GP was also measured in the same way after overnight incubation of Control (red) and SCD-cells (cyan symbols) with 20 µg/mL apoA-I. No difference was detected among samples without addition of apoA-I (¤ symbol, with P<0.05). Instead, GP decreased significantly for both types of cells after the addition of apoA-I (* symbols, P<0.05). e) Cells (Control and overexpressing SCD), were incubated in the absence or in the presence of 10 mM MβCD for 30 min. Experimental data are analyzed as in Figure d. As in d, statistically non difference is shown with ¤, while * represents a significant increase or decrease of membrane GP after treatment with MβCD of Control or SCDcells, respectively (P<0.05).
