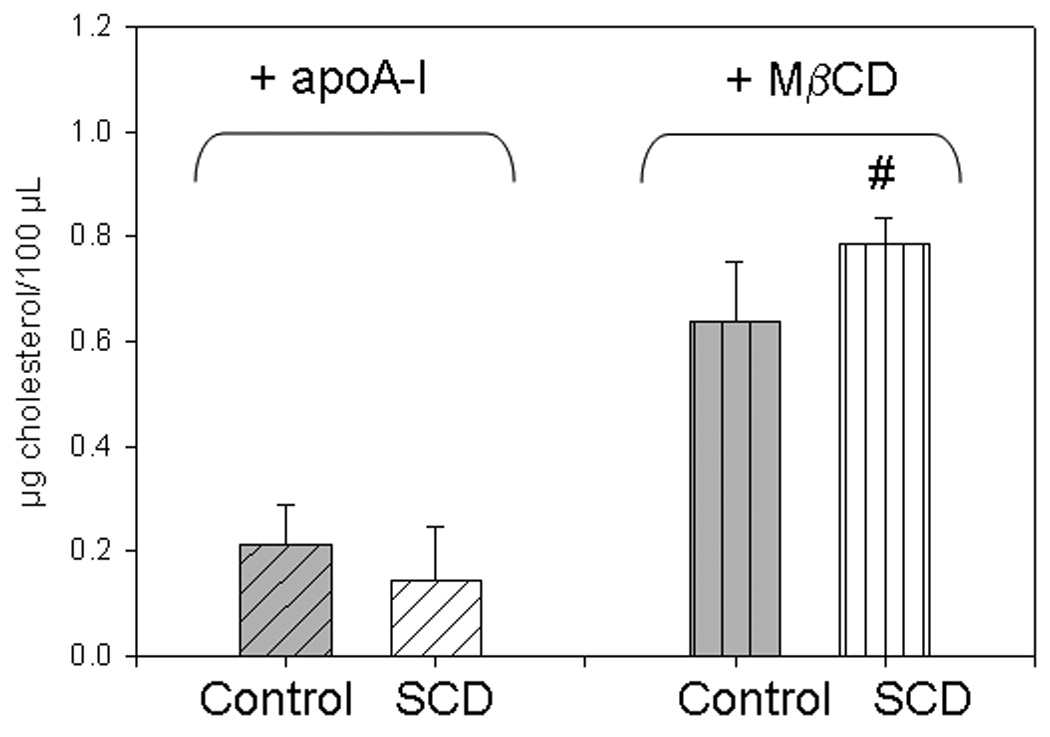
Figure 4. Cholesterol removal to different acceptors.

Cells were in a 96 well-plate and incubated as described above, overnight in the presence of 20 µg/mL apoA-I (diagonally-lined bars), or by 30 min with 10 mM MβCD (vertically-lined bars). Cholesterol in the media at the end of the treatments was analyzed as described in Methods. Symbol * indicates statistic increase of Chol removal by SCDcells (white filled), as respect to Control cells (gray filled bars) (P < 0.05)
