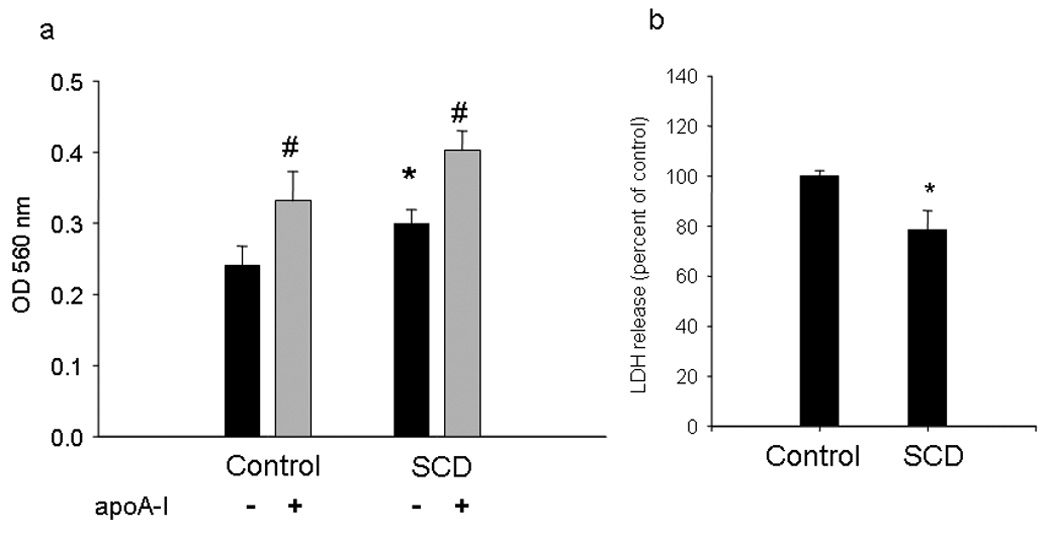
Figure 5. Cellular viability.

a) Mitochondrial metabolism assay: Cells were grown in a 96-well microplate, and MTT reduction was evaluated with or without overnight incubation with 20 µg/mL apoA-I. The formation of formazan was quantified by absorbance at 560 nm (*P < 0.05 compared to Control, untreated cultures; # indicates P < 0.05 compared to the same type of cells incubated in the absence of apoA-I). Results are the means of 5 experimental points. b) Lactate dehydrogenase (LDH) release into the medium. Cells were grown as explained in Methods, and LDH in the medium was determined by kinetics of disappearance of NADH at 340 nm. Results are the means of triplicate samples.(*P < 0.05 compared to Control, untreated cultures).
