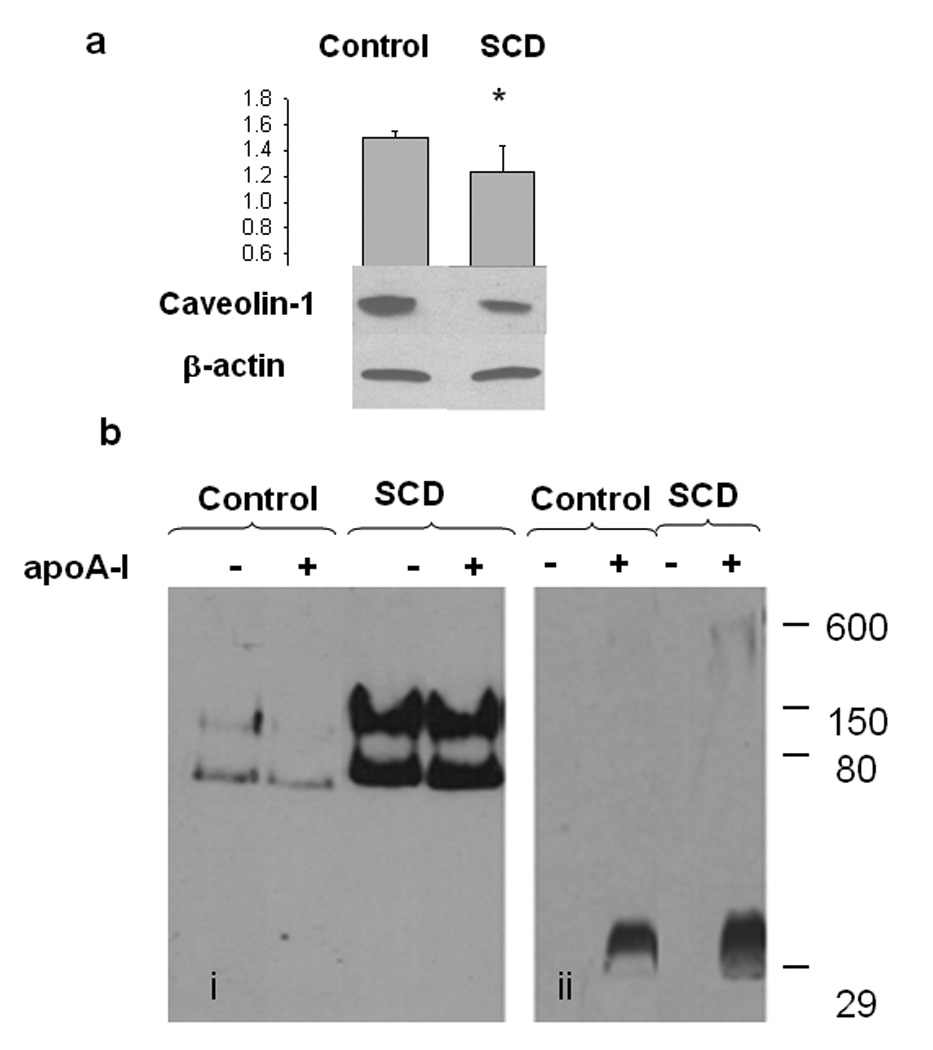
Figure 7. Intracellular and exportation levels of caveolin-1.

a) Control and SCD-cells were grown and incubated as previously described. Following culture cells were scrapped, lysed and homogenized. The same amount of protein from the different treatments was loaded on a 12 % PAGE with 10% SDS, western blot developed against a-caveolin and following stripping developed against β actin. Bands of four different samples of Control or SCD-cells were scanned and the relative intensity of each band quantified by the Image Quant software. The ratio caveolin/actin averaged and shown in the top panel.(*P < 0.05 compared to Control, untreated cultures).
b) Control and SCD-cells were grown and incubated with apoA-I as previously described. After 12 h incubation with DMEM or apoA-I, media was collected, centrifuged for 15 minutes at 5.000 rpm, and concentrated; the same amount of total protein of the different treatments was loaded on a native 4–25% polyacrylamide gradient electrophoresis gel (bi) and revealed by using polyclonal caveolin-1 antibody. bii) An equivalent gel was loaded and run exactly under the same conditions, but revealed against polyclonal a-apoA-I. Numbers on the right side of the Figure correspond to molecular weight standards.
