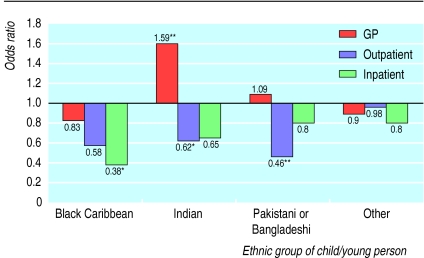
Figure.
Comparison of odds ratios of health service use by children and young people from minority ethnic groups (compared with white population) controlling for age, sex, socioeconomic status, and perceived health status of patient. *P<0.05, **P<0.01 (signficance of difference from reference category of white). Data from general household survey, 1991-94

