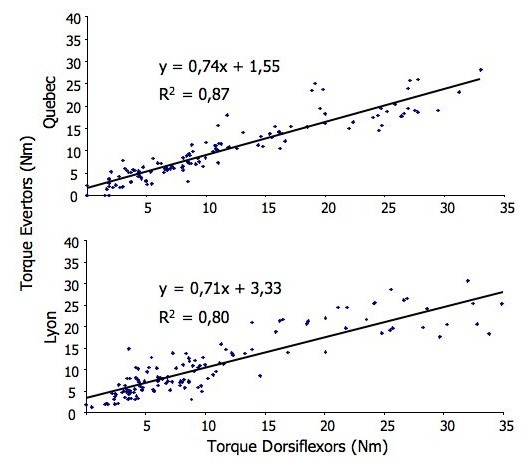
Figure 4.

Relationships between the maximal strength (Day 1 and D 21 values combined; n = 180 trials) of the ankle evertors and dorsiflexors for Quebec and Lyon as estimated with simple linear regression. The equation and coefficients of determination R2 are indicated for each centre.
