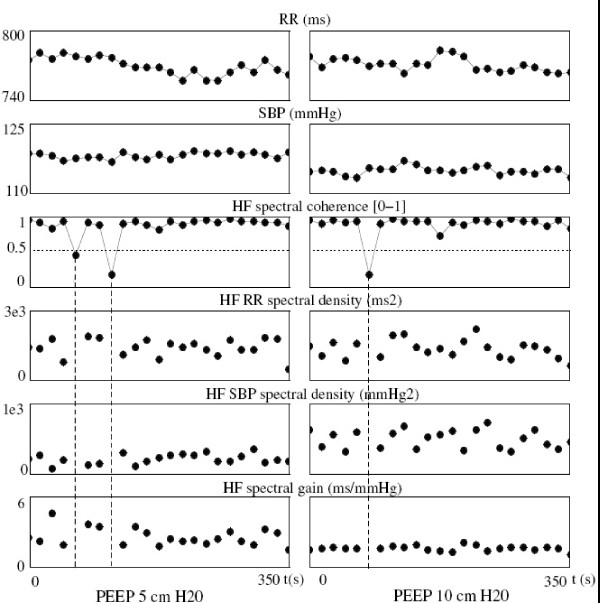
Figure 2.
Comparison of the spectral gain parameters between PEEP 5 and PEEP 10, in one subject, representative of the mean behavior of all patients. Each dot represented an averaged value over 16 seconds. Raw RR and SBP remained at the same level, while the gain was lower at PEEP 10, due to the increase in SBP spectral density. The mean coherence value and the percentage of time (in number of 16-second epochs) with coherence under 0.5 did not significantly differ between PEEP 5 and PEEP 10. Dashed lines showed 3 epochs with low coherence, discarding them from the analysis.

