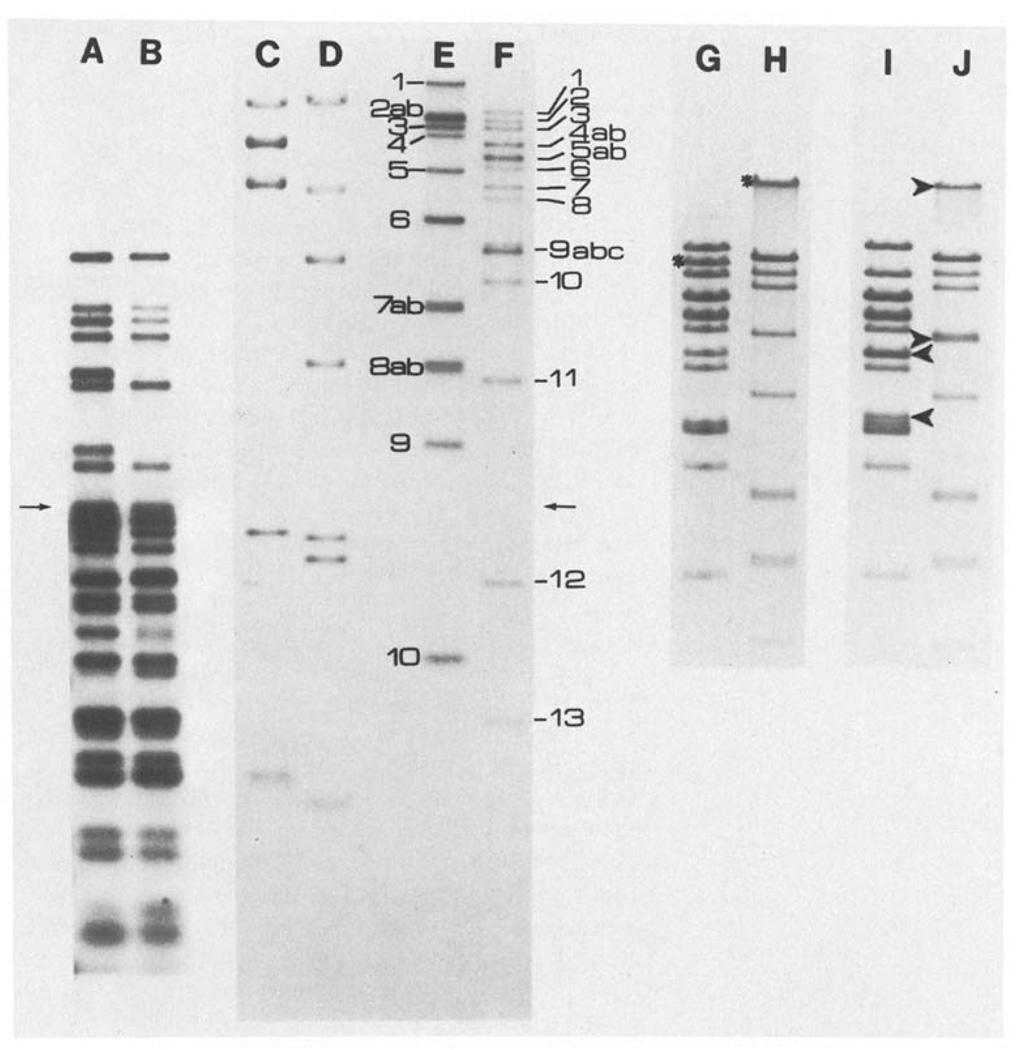
Fig. 3.
A–J. Representative one dimensional separations. The samples shown in lanes A–F were electrophoresed through a composite gel, the first half being 0.5% and the second half being 1.5% agarose (the arrows indicate the junction of the two gel concentrations). Lanes A–F are from an autoradiogram of this gel. Lane A shows fragments which were produced by XhoI cleavage of T4 DNA, labeled and then further cut with EcoRI (XhoI(32P)/EcoRI). Lane B shows the same sample as A but further digested with BglII (XhoI(32P)/EcoRI, BglII). The sizes determined for the fragments in lane A give the distance between XhoI sites and the adjacent EcoRI sites. These sizes were also used for internal calibration of two dimensiional separations where XhoI cut fragments are separated in the first dimension, recut with EcoRI and separated in the second dimension (XhoI-EcoRI). For molecular weight markers, λ CI857 S7 DNA obtained from Rae Lynn Burke was cut with BglII (lane C) or HindIII (lane D) and labeled. Lanes E and F show respectively, T4 DNA digested with BglII or XhoI and labeled. The band assigments are indicated. Lanes G–J show stained patterns obtained from T4 DNA digested with XhoI (Lane G), BglII (lane H), XhoI and BamHI (lane I) or BglII and BamHI (lane J) and electrophoresed on a 0.5% agarose gel. The stars indicate the bands formed by fragments containing the BamHI site; in the double digests (lines I and J) the arrowheads indicate the positions of the bands generated by BamHI cleavage. The cleavage of BglII 1 is not obvious because fragments in this molecular weight range do not separate well

