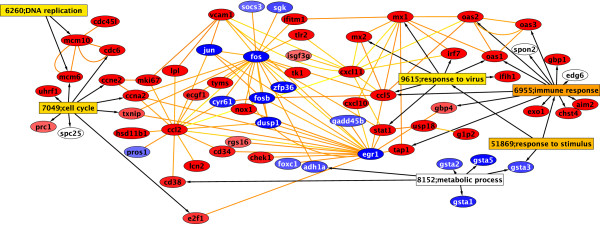
Figure 1.
Network of significant genes and GO nodes at 24 hours. The Gene Ontology nodes found to be significant in the BiNGO analysis are shown as rectangles, with the more orange nodes being more statistically significant. The genes associated with the GO nodes are listed in ovals connected by black arrows to the GO nodes. These genes are further connected to other genes in the Human Network via yellow and orange edges. Red ovals indicate up-regulated genes while blue indicates down-regulated genes (see Additional files 1 &2).

