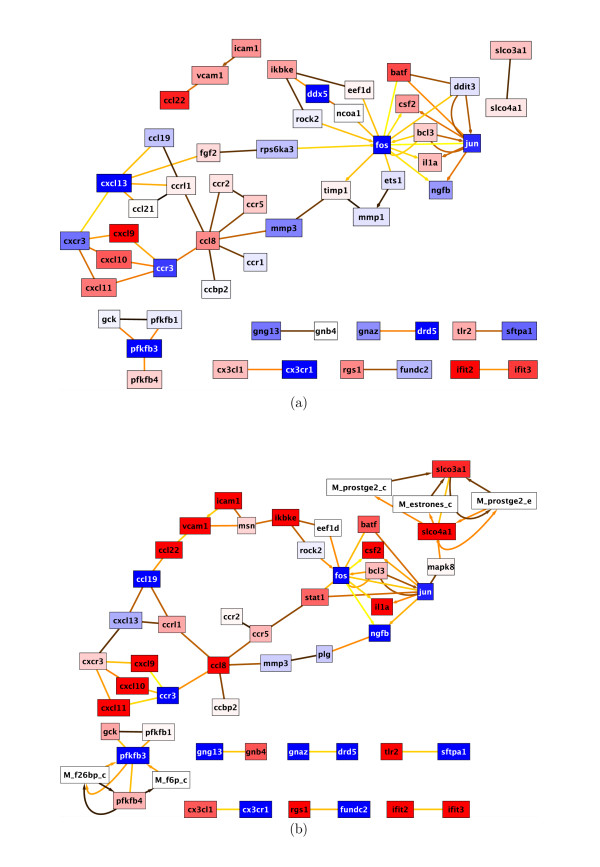
Figure 4.
Differential expression network between H5N1 and RSV. Response network of differentially expressed genes between H5N1 and RSV. (a) A response network H5N1 versus RSV at 8 h is shown with 54 nodes and 65 interactions. The network was calculated with parameters k = 3 and l = 4.5. (b) A H5N1 versus RSV response network at 24 h is depicted with 53 nodes and 71 interactions. Parameters k = 3 and l = 5 were used for calculation. Color coding is according to Figure 1. Edges with arrows indicate chemical reactions, diamond-shaped edge tips denote activation, circle-shaped tips refer to phorphorylation reactions and non-decorated edges are non-directional interactions by physical binding or by inferrence from the iHOP database (see Additional files 7, 8, 9 and 10).

