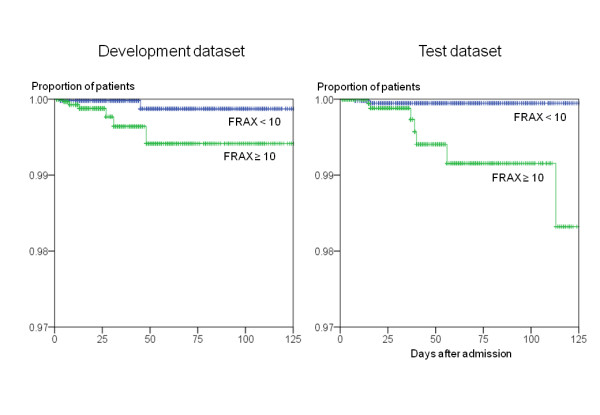
Figure 1.

Survival plots for fractures after falls. All patients were plotted on the Kaplan-Meier survival curve as a function of length of stay. Cumulative rates of fractures after falls were compared between patients with FRAX™ score of more than 10 and patients with FRAX™ score of less than 10.
