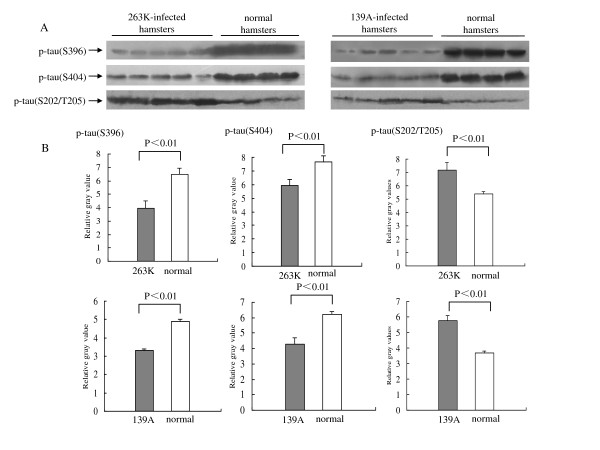
Figure 4.
Analysis of the levels of p-tau (Ser396), p-tau (Ser404) and p-tau (Ser202/Thr205) in the brain tissues of normal and scrapie-infected hamsters collected at the moribund stage. A. Western blots. Same amounts of individual brain homogenate were loaded in 12% SDS-PAGE. The scrapie agents and normal controls were shown on the top of the graphs. Various specific immunoblots were indicated by arrows on the left. B. Quantitative analysis of each gray numerical value of p-tau (Ser396), p-tau (Ser404) and p-tau (Ser202/Thr205) vs that of β-actin. The average values were calculated from five individual infected hamsters or four individual normal hamsters and presented as mean ± SD. Statistical differences compared with controls were illustrated as P < 0.05 and P < 0.01.

