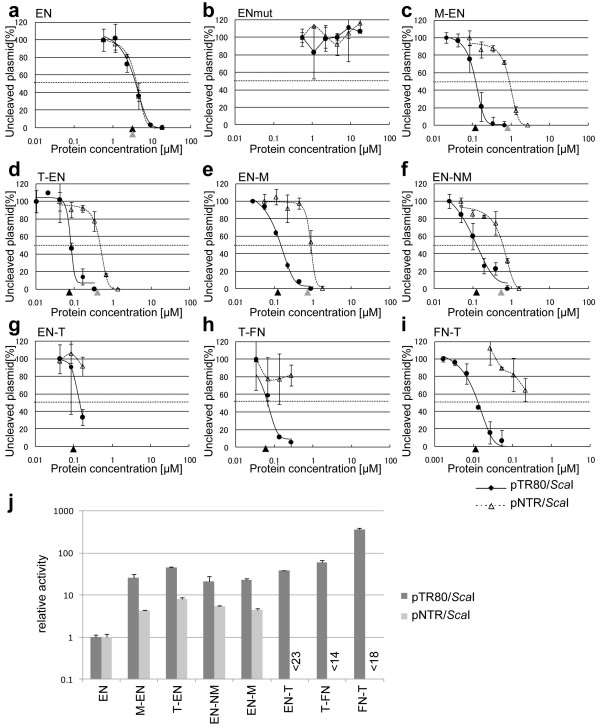
Figure 3.
Comparison of cleavage activity of chimeric endonucleases. (a-i) pTR80/ScaI or pNTR/ScaI was mixed with purified protein. Cleaved plasmid was separated by electrophoresis and the intensity of bands corresponding to uncleaved plasmid was determined using a densitometer and ImageJ (bar: ± standard deviation). The cleavage for pTR80 and pNTR is shown by solid line (with filled circles) and dotted line (with open triangles), respectively, in each figure. Protein concentration (μM) is shown on the horizontal axis. EC50 is shown as black arrow head for pTR80 and gray arrow head for pNTR. (j) The reciprocal EC50s of chimeric endonucleases for pTR80/ScaI and pNTR/ScaI were calculated (bar: ± 95% confidence interval), and each relative activity is shown based on the value of reciprocal EC50 of EN for pTR80/ScaI as 1.

