Figure 5.
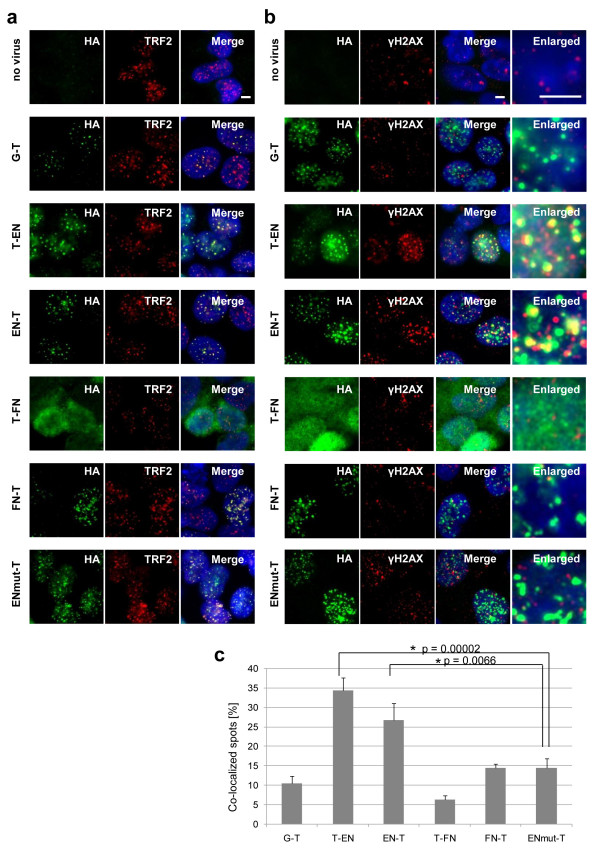
Subcellular localization of expressed chimeric endonucleases. (a) Telomere localization of expressed chimeric endonucleases. We infected adenovirus that expresses a chimeric endonuclease at MOI 100 to U2OS cells and performed indirect immunofluorescence the next day. Fusion proteins were detected with anti-HA antibody (green), and telomere was detected with anti-TRF2 antibody (red). Nuclei were stained with Hoechst33342. Yellow dot signals represent the colocalization of fusion protein and telomere. The scale bar is 10 μm. (b) Telomere cleavage by expressed chimeric endonucleases. In order to visualize telomere cleavage by chimeric endonucleases, fusion proteins were detected with anti-HA antibody (green) and DNA double-strand breaks were detected with anti-γ-H2AX antibody (red). (c) Based on the results in (b), we calculated the ratio (%) of co-localized spots (yellow) to fusion protein signals (green) using ImageJ (bar: 95% confidence interval). * shows a statistically significant increase of colocalization to ENmut-T (P < 0.01).

