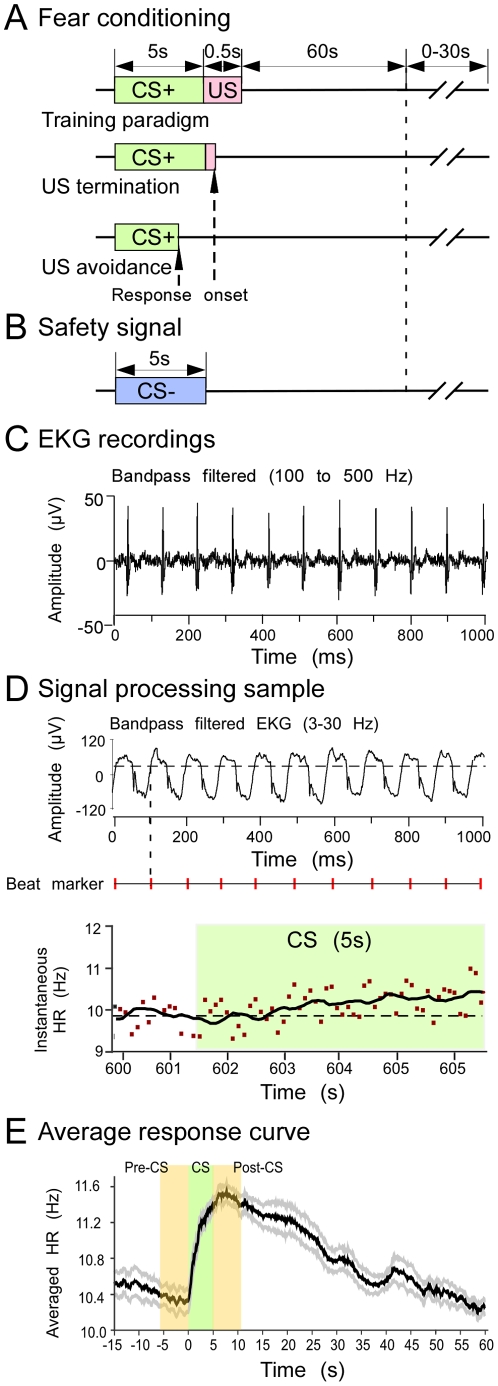
Figure 2. Schematic showing the CS presentation paradigm and HR recordings and analysis.
(A) Illustration of the fear-conditioning paradigm. The CS+ was paired with shock to one leg. Either vocalization or leg movement terminated the US (see text for details). (B) The safety signal (CS−) was not paired with shock. (C) Band passed EKG trace showing HR recordings. (D) The filtered and amplified signal (top) used to generate beat markers (middle) that correspond (vertical dashed line) to the time of threshold crossing (horizontal dashed line). Bottom panel shows time of beat markers converted to instantaneous HR before and during presentation of CS (shaded segment) in a single trial. Note the consistently variable, but gradual increase in HR. (E) Averaged response curve obtained after CS presentations. HR increased dramatically after CS onset, and steadily declined over the next 40 s.

