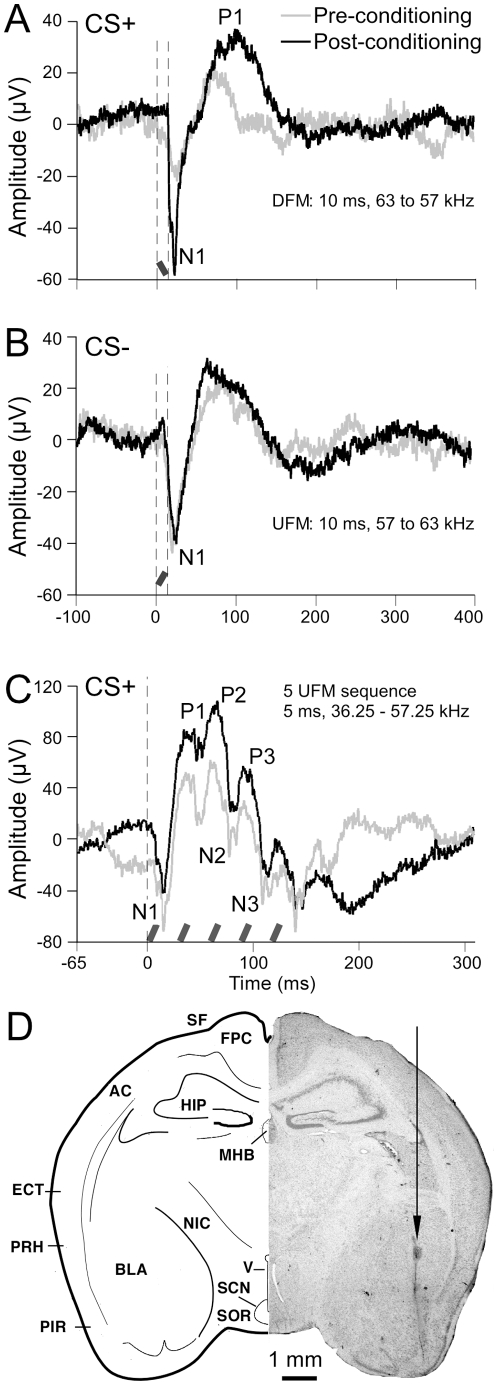
Figure 8. Two examples of US induced enhancement of the LFP to CS+.
Line plots show averaged LFPs evoked by FM sweeps before (grey trace) and after (black trace) conditioning. (A) LFP responses after 100 repetitions of the target stimulus CS+ (a single DFM at a rate of 0.6 kHz/ms). (B) LFP response to CS−, and (C) LFP response to a sequence of 5 FM sweeps (CS+) pre- and post-conditioning presented at rate of 40 Hz; onset is indicated by vertical dashed line. Responses were obtained from depths of 3.71 mm (A and B) and 3.50 mm (C) from the brain surface and ∼3.1 mm from the midline. Vertical dashed lines and black/grey diagonal bars indicate stimulus onset and offset. Labels indicate enhanced peaks P1 to P3. D. Charting (left) and photomicrograph (right) of a histological section in the transverse plane to show the location of the electrolytic lesion (arrow) at a LFP recording site. AC: auditory cortex, BLA: baslolateral amygdala, ECT: ectorhinal cortex, FPC: frontoparietal cortex; MGB: medial geniculate body; MHB: medial habenular nucleus, NIC: nucleus of the internal capsule, PIR: piriform cortex, PRH: perirhinal cortex, RS: rhinal sulcus. SCN: suprachiasmatic nucleus, SF: Sylvian fossa, SOR: retrochiasmatic part of the supraoptic nucleus, v; fourth ventricle.

